

The NGINX Plus live activity monitoring dashboard is completely redesigned in NGINX Plus Release 7 (R7). The new dashboard makes it even easier to identify and understand problems with your infrastructure and make rapid changes to your configuration. A new Dashboard overview tab provides an at‑a‑glance summary of the health of the system and the traffic going through it. From there you can drill down to more detailed information about virtual servers and backend servers. You can even make temporary changes to your load‑balancing configuration, such as adding, removing, and modifying backend servers, all from the dashboard.
Editor –
- In NGINX Plus R8 and later, changes you make on the dashboard can persist across restarts and configuration reloads.
- In NGINX Plus R9 and later, NGINX Plus handles UDP traffic as well as TCP traffic, and reports it on the TCP/UDP Zones and TCP/UDP Upstreams tabs.
- For an overview of all the new features in NGINX Plus R7, see Announcing NGINX Plus R7 on our blog.
- For detailed discussions of other new features in NGINX Plus R7, see these related blog posts:
A live demo of the dashboard is available here. Read on for an overview of the new NGINX Plus dashboard.
The Dashboard Overview Tab
When you first open the dashboard, the overview Dashboard tab gives a complete, single‑page summary of NGINX Plus activity and of the health of your application servers.
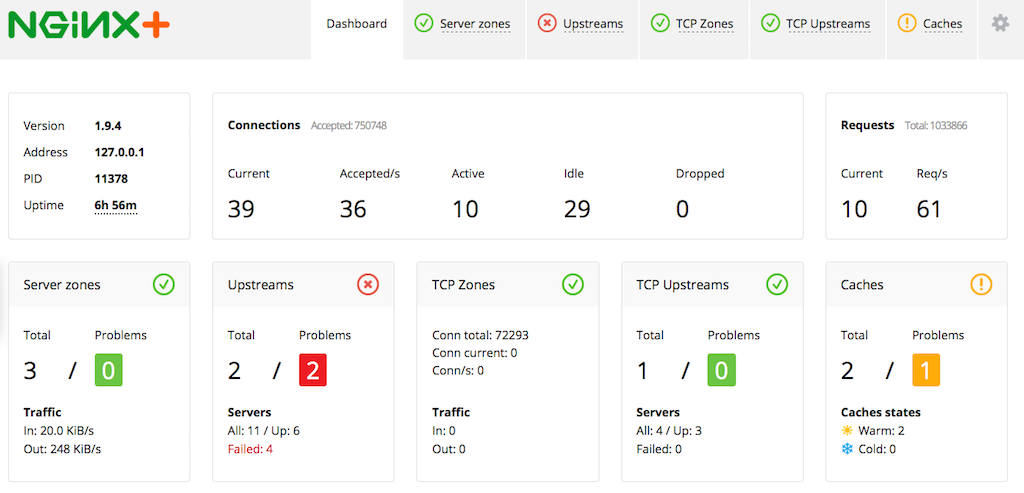
On the Dashboard tab you can quickly learn:
- General system information – The top left box reports the NGINX Plus version number, the server’s IP address, the PID of the NGINX Plus master process, and its uptime.
- The current load on the system – A large number of Active connections in the Connections box or Req/s in the Requests box can indicate that the system is under heavy load or DDoS attack.
- The severity of any problems – Red, yellow, and green indicators throughout the dashboard visually identify serious errors and warnings or let you know everything is okay.
- The current health of your application – The Upstreams and TCP/UDP Upstreams boxes report numbers of healthy and failed servers.
New Tabbed Interface
The row of tabs at the top of the window make it easy to drill down to more detailed information about server zones, upstream groups, or the cache.


The tabs have red, yellow, green indicators for quick and easy identification of health problems.
- The Server zones and TCP/UDP Zones tabs provide data on the front end of NGINX Plus, where it interacts with web browsers and other clients. The number of incoming client connections and requests are examples of the data included on these tabs.
- The Upstreams and TCP/UDP Upstreams tabs provide data on the back end of NGINX Plus, where it interacts with the servers for which it is reverse proxying and load balancing. Using the editing interface on this tab, you can add, remove, and modify the servers in an upstream group. In NGINX Plus R8 and later, you can configure NGINX Plus so that changes made using the dashboard persist across restarts and configuration reloads.
- The Caches tab displays the status of your content caches.
Server zones Tab
The Server zones tab gives detailed statistics on the frontend performance of NGINX Plus. Statistics are reported per HTTP virtual server as configured with the server directive in the http context. For NGINX Plus to collect information for a virtual server, you must include the status_zone directive in its configuration block.
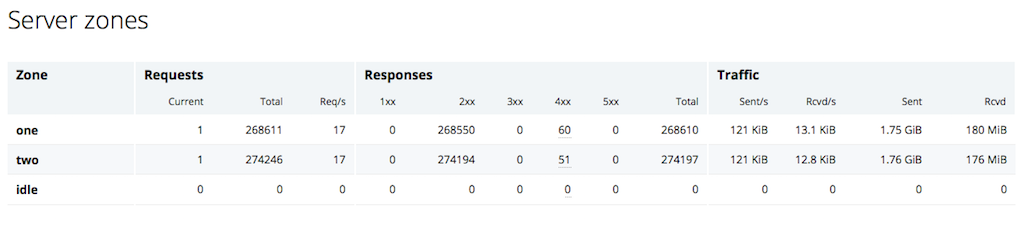
The Server zones tab provides the following information:
- The Requests and Traffic sections provide a good indicator of system load. For example, large values in one or more of the Req/s, Sent/s, or Rcvd/s columns indicate heavy load or potentially a DDoS attack.
- The Responses section breaks down responses sent to clients by response code. A large number of
4xxand5xxerrors can indicate issues with your application.
Upstreams Tab
The Upstreams tab provides information about each group configured with the upstream directive, which groups the backend servers to which NGINX Plus reverse proxies and load balances traffic. The Upstreams tab provides information about the upstream groups for HTTP and HTTPS traffic (TCP and UDP upstream groups appear on the TCP/UDP Upstreams tab).
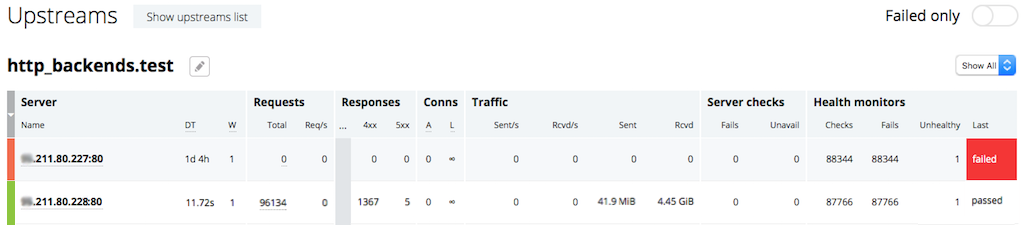
The statistics on this tab are similar to those on the Server zones tab, the difference being which connections they are collected for. The Server zones tab reports statistics about connections between NGINX Plus and clients, whereas the Upstreams tab reports statistics about NGINX Plus talking to backend servers.
On this tab you can quickly find out which servers have failed as well as other valuable statistics:
- Toggle the Failed only switch in the top right corner to quickly display only failed servers across all upstream groups. Setting this switch to on resets all the local filters below it.
- The Requests and Traffic sections indicate how evenly traffic is being distributed across the servers in each upstream group.
- The Responses section breaks responses down by response code. A large number of
4xxand5xxerrors can indicate issues with your application. - The Conns sections displays the number of active connections from NGINX Plus to each server, along with the connection limit (if you have configured one with the
max_connsparameter to theserverdirective).
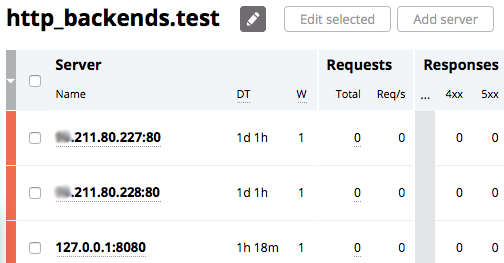
To add, remove, or modify the servers in an upstream group, clicking the pencil icon next to its name. The Edit selected and Add server buttons appear and the icon switches to a white pencil on a dark background.

Adding a Server
Click Add server to bring up the editing interface:
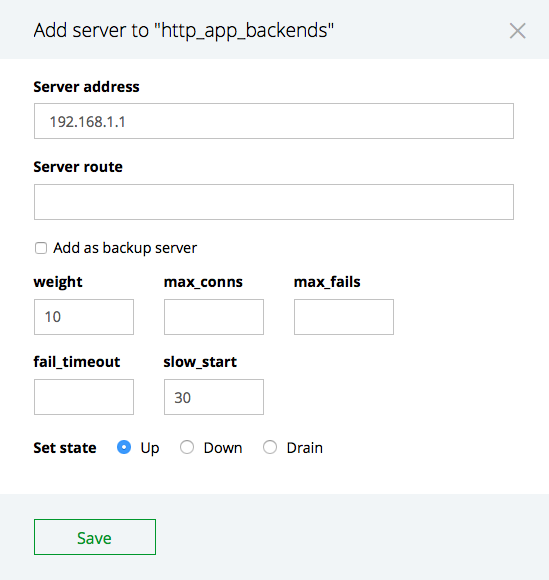

Except for the Server address, the fields are optional and have default values. If you do not click a Set state radio button, Up is selected by default. For details on the configurable fields, see the documentation for the server directive.
Removing and Modifying Servers
To remove or modify servers, click the box to the left of each server’s name, then click Edit selected to bring up the editing interface:
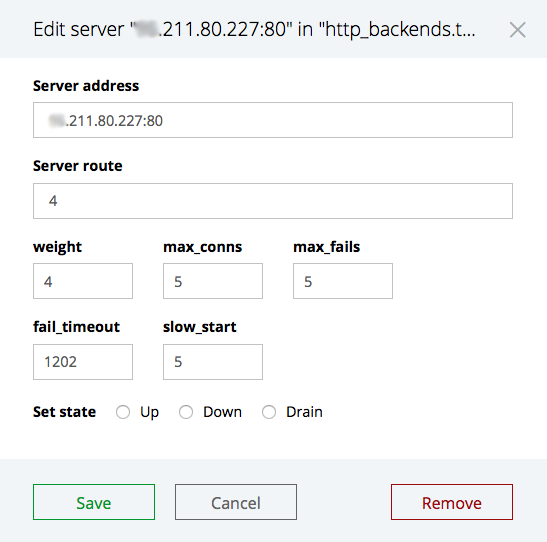

The boxes correspond to parameters to the server directive; click the Save button to save any changes you make. To remove a server altogether, click the Remove button.
Note: In NGINX Plus R8 and later, you can configure NGINX Plus so that changes made using the dashboard persist across restarts and configuration reloads. In releases prior to NGINX Plus R8, you must duplicate the changes in the NGINX Plus configuration file to make them permanent.
Caches Tab
The Caches tab provides statistics about the caches configured in NGINX Plus.
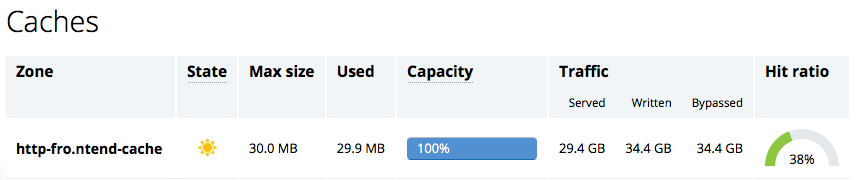
The following information is provided:
- The State of the cache – whether it’s ready to be used (


- The Capacity bar shows how full the cache is. When it’s at or near 100%, increase the size of the cache to avoid having data deleted from the cache even though it’s being accessed frequently.
- The Hit ratio dial tracks how well the cache is performing. A low hit ratio indicates that most requests cannot be satisfied from the cache and must be forwarded to backend servers. For help on tuning the cache, please see A Guide to Caching with NGINX.


And Much More
There is a lot to more to explore on the NGINX Plus dashboard:
- The TCP/UDP Zones and TCP/UDP Upstreams tabs provide the same kind of information as the Server zones and Upstreams tabs, but for TCP and UDP traffic rather than HTTP/HTTPS traffic.
- Tooltips throughout the dashboard give more detailed information about upstream servers, configuration reloads, cache status, and any error messages.
Try out the live activity monitoring dashboard in your environment – start your free 30‑day trial today or contact us to discuss your use cases.