

In a short five years, NGINX, Inc. has gone from powering zero to powering one in every six of the busiest web sites on the Internet. Datadog uses NGINX and chances are you do too. Datadog is pleased to announce the expansion of our current NGINX monitoring tool to support the additional features in NGINX Plus.
Launched in 2013, NGINX Plus is the fully supported, commercial version of NGINX that offers basic open source modules and additional enterprise‑grade features. In particular, this premium product provides:
- Live activity monitoring of HTTP requests by status and upstream server in much greater detail
- Health checks for custom pages and applications, to support more complex failure cases
- Advanced load balancing features, including on‑the‑fly reconfiguration of upstream server groups
Monitor NGINX Plus Metrics in Datadog
Datadog expands the existing plug‑in for NGINX Open Source to support the advanced live activity monitoring in NGINX Plus. Datadog now collects all metrics exposed by the NGINX Plus Status module, including:
- Connections accepted, dropped, active, and idle
- Bytes sent and received by each server zone
- Number of health checks failed
- Response counts, categorized by status code and upstream server
You can see a sample of all NGINX Plus metric names and their tagging structure here.
NGINX Connections and Upstreams
Tags are the linchpin of monitoring with Datadog. They are used everywhere to navigate data, define graphs, and create alerts easily, whether you have 5 or 5,000 servers. With tags you can slice and dice metrics, graphs, and alerts, and get an inventory of servers to quickly pinpoint the servers you wish to look into.
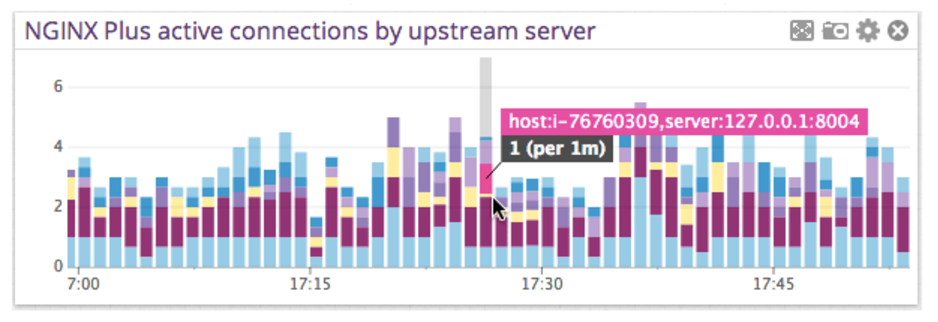
The new integration with NGINX Plus tags all NGINX Plus metrics for you with the correct upstream server and server zone, so that you can very easily see how traffic gets distributed between NGINX Plus servers, zones, and individual upstream servers. For example, in the graph below we are showing active connections per minute, split by upstream server.

Aggregate, Alert On, and Graph NGINX Plus Metrics
Datadog automatically creates a metric for every combination of upstream pool, upstream server, and server zone. These metrics can be aggregated in order to monitor an entire upstream pool or cluster of upstream pools. Furthermore, metrics from multiple NGINX Plus servers can be aggregated into a single, high‑level metric for the entire web service served via NGINX Plus.
You can graph any of these metrics on Datadog dashboards or receive alerts on them via email, PagerDuty, HipChat, Slack, or webhooks. Datadog’s high‑resolution historical data makes it a snap to conducting a drill‑down analysis for any event that happened over the last year.
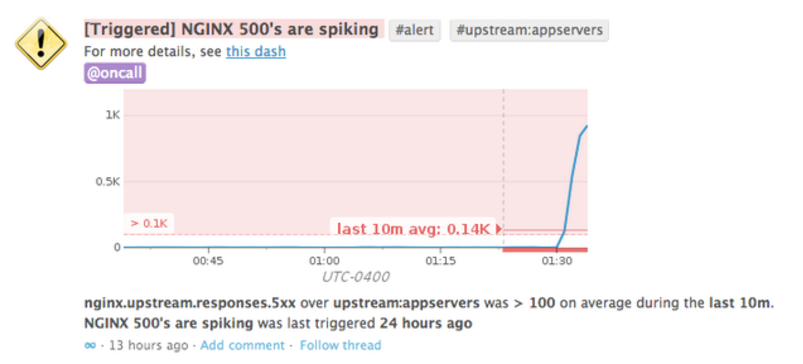

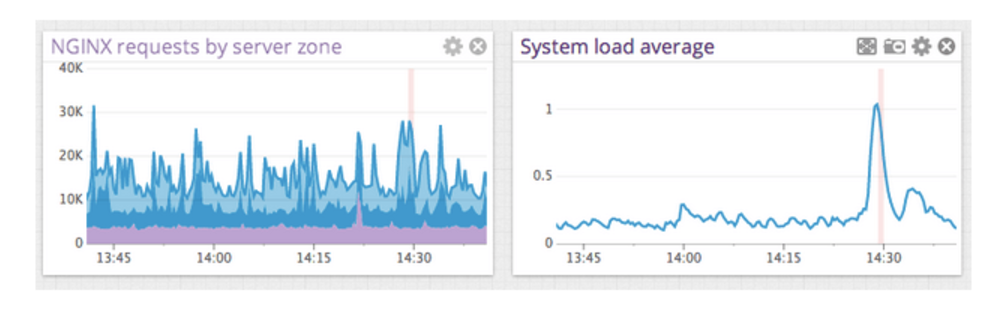
Correlate Events from Other Systems with NGINX Plus Metrics
You can overlay events from the other 50+ Datadog integrations on top of the NGINX Plus metrics. With a side‑by‑side view of events and related dashboards of metrics, you can drastically cut the time you spend investigating and correlating events and metrics coming from different parts of your infrastructure.

If you want the kind of visibility into your HTTP load balancing described in this article, first sign up for a free trial of NGINX Plus. Then try a 14‑day free trial of Datadog to instantly gain insight into NGINX metrics. Visit the Datadog NGINX Integration page to learn more about the Datadog NGINX integration.