We were pleased to announce general availability (GA) of NGINX Controller, our centralized management platform for NGINX Plus instances, on June 26. In our initial announcement blog post, we outlined how NGINX Controller solves challenges faced by enterprises as they undertake their digital transformation journey.
This blog details key capabilities of NGINX Controller R1, which supports full lifecycle management of NGINX Plus load balancers – from initial deployment and validation to ongoing troubleshooting and maintenance.
Features in NGINX Controller R1 include:
- Simplified configuration management – NGINX Controller enables management of NGINX Plus servers at scale, easily and across a multi‑cloud environment. Controller’s intuitive, wizard‑style interface guides your creation of new instances of NGINX Plus and enables you to centrally configure features such as HTTP routing by URL, load balancing, and SSL/TLS termination, all with just a few clicks.
- Monitoring, alerting, and troubleshooting – Controller provides deep visibility and critical insights into more than 200 advanced performance and transaction metrics for NGINX Plus instances. You can set thresholds for these metrics and receive alerts when there’s a breach. Built‑in and customizable dashboards enable you to assess the health of your environment.
- Tagging – Tagging helps you organize and categorize all your NGINX Plus instances. You can use tags to monitor specific environments, such as staging or production, as well as public clouds, such as AWS, or private clouds hosted on‑premises.
- Analyzer – Analyzer functionality provides actionable recommendations based on best practices from diverse customer environments, enabling you to fine‑tune your configurations. These recommendations also provide guidance on resolving performance and security issues.
- Instance inventory – Controller provides an inventory of all your NGINX Plus instances. This is very useful for asset management and auditing purposes.
- Multi‑cloud support – NGINX Controller is delivered as a Docker package. You can deploy Controller on any public or private cloud to manage NGINX Plus instances operating across a multi‑cloud environment.
- Rest API – You can export all performance metrics via the NGINX Controller REST API for seamless integration with any monitoring tool.

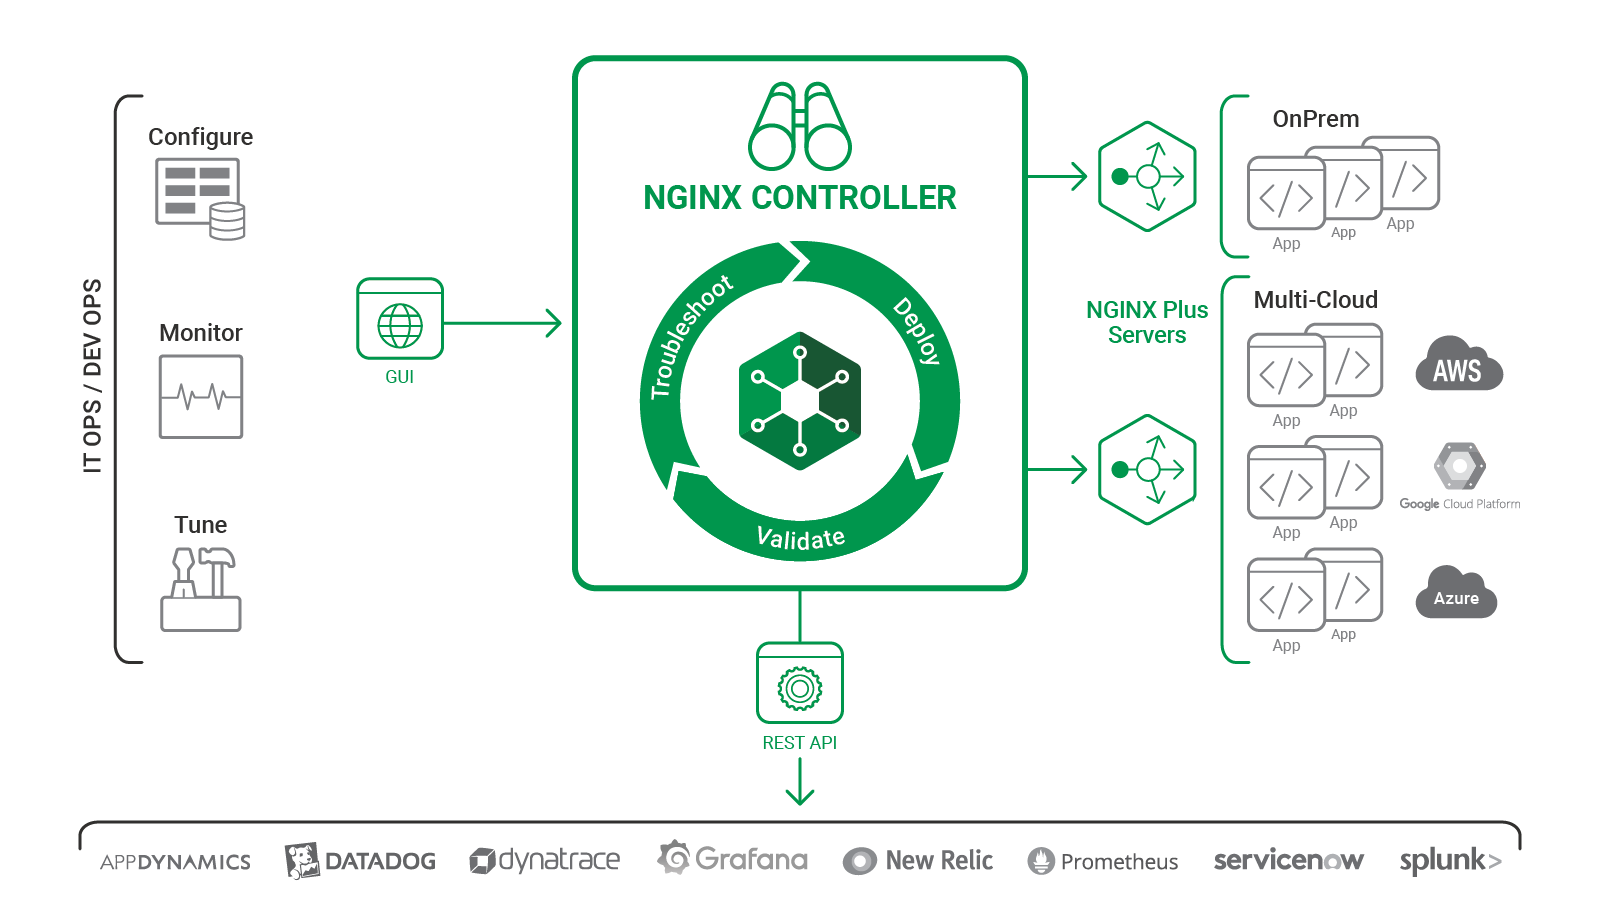
NGINX Controller features are powered by a small agent that’s installed on target NGINX Plus servers. Once the agent is installed and registered, NGINX Plus instances can be managed using NGINX Controller. The agent gathers performance data about these instances and sends it back to NGINX Controller for analysis. With the agent in place, Controller is able to carry out a wide range of reporting and management functions.
NGINX Controller Features in Detail
While NGINX Controller is easy to use, it incorporates both breadth and depth of functionality. Here we describe Controller’s capabilities, but you will get the best feel for what it can do for you by using it in your own environment.
Simplified Configuration Management
Controller provides a wizard that helps you set up a new load balancer easily, in just five steps. Using an intuitive interface, you can create and edit commonly used load‑balancing configuration options, such as:
- Load‑balancing algorithms (five choices)
- Using SSL certificates
- Implementing health checks
- Specifying custom error pages
- Defined routes, with pattern‑based matching, to specified sets of upstream servers
All of these configuration options include NGINX‑recommended practices as default options.
Controller supports a policy‑based approach to management. You can quickly create configurations for test, staging, production, or line‑of‑business–specific applications, enabling developers to deploy applications faster.

The figure shows a variety of configurations, including AWS environments for staging and production labeled AWS_USW_1_Staging and AWS_USW_2_Production, respectively. We created these using the wizard. The staging configuration for www.nginxlab.com consists of two upstream servers with IP addresses 10.2.3.10 and 10.2.3.11. This configuration is activated on the NGINX Plus instance when you click the Push Configuration button.
Monitoring, Alerting, and Troubleshooting
Controller provides real‑time visibility as well as historical trending for more than 200 health and performance metrics. These include:
- Advanced performance metrics – From the NGINX Plus API, metrics such as rate, bandwidth, errors, latency, health checks; all reported per server zone and/or per upstream
- Transaction metrics – Response codes, rates, bandwidth, latency, and cache; can be filtered by URI, host header, upstream, user agent, and other values
- System performance metrics – From the host: CPU, disk, network, memory, and load; from NGINX: CPU, file descriptors, I/O, and memory
Monitoring these metrics helps you find the root cause of performance and security issues. Listed below are examples of some questions that Controller can help answer:
- What is the uptime of all my NGINX Plus instances?
- When do we see slowdowns?
- When are HTTP errors occurring?
- Are my upstream servers healthy?
- Is stale cached data getting purged? Is the cache warm or cold?

The figure shows trending of connections per second and total number of connections over the last four hours for AWS_EC2_Instance_2. Mousing over the peak at 14:00, you can see that NGINX Plus was handling about 184 connections per second.
You can set thresholds for metrics and receive alerts via email when a threshold is exceeded.
NGINX Controller has a built‑in Overview dashboard. This dashboard includes an Application Health Score, which is an aggregate measure of successful requests and the timeliness of requests. You can set low and high thresholds for request time.
While maintaining a very high Application Health Score is always a goal, the parameters that constitute this score are application‑dependent. For instance, you may want client requests to be fulfilled within one second for an application that’s in production, but accept a much higher request‑time window for an application running in test environment.
The dashboard lets you showcase application health to key stakeholders, such as senior management for your team. You can also quickly create your own dashboards to help you focus on metrics that are of interest to you.
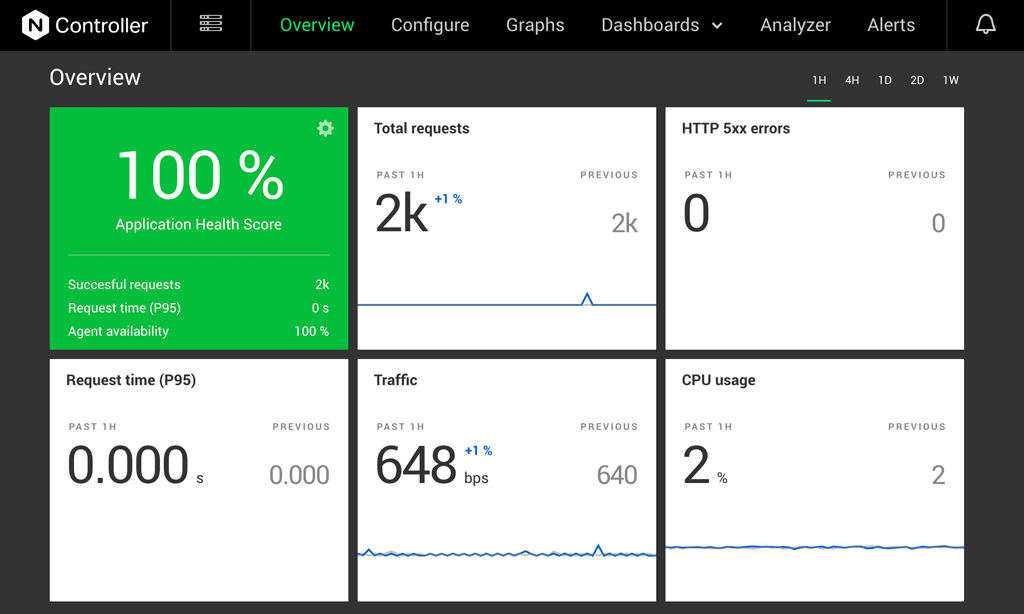
The figure shows KPIs that are necessary to assess the health of your environment. For this environment, Application Health Score has remained at 100% over 2000 requests. There are no HTTP 5xx errors. There are no delays in fulfilling client requests. CPU is not stressed at all – CPU usage is very low at 2%.
Tagging
Tagging is a powerful mechanism to organize and manage your configurations. You can create and assign tags to categorize and monitor your load balancers based on purpose, environment, location, or any characteristic you choose. You can filter dashboard views by tags, enabling you to monitor specific environments, such as production or staging.
Controller can send alerts about NGINX Plus instances that have specific tags. So you can prevent notification storms by applying specific tags to alerts – for instance, you might only be interested in receiving alerts about AWS, or about production environments.
Analyzer
Analyzer provides actionable best‑practice recommendations based on the experience of the NGINX team with thousands of support cases, as well as from consulting engagements supporting complex deployments. We want you to benefit from the collective wisdom accumulated from our many customers over more than a decade of NGINX use in production.
Analyzer provides the following benefits:
- Validate – You can validate your configuration before moving to production
- Troubleshoot – Guidance provided by these recommendations can be the first step toward resolving performance and security issues
- Optimize (reconfigure) aging configurations – If a config has been used for a long time, it might be based on out‑of‑date standards
When a config has gotten too far out of date, Controller can prompt you to start a fresh config from scratch, based on best practices. It helps you “knock the rust off” your existing NGINX infrastructure.
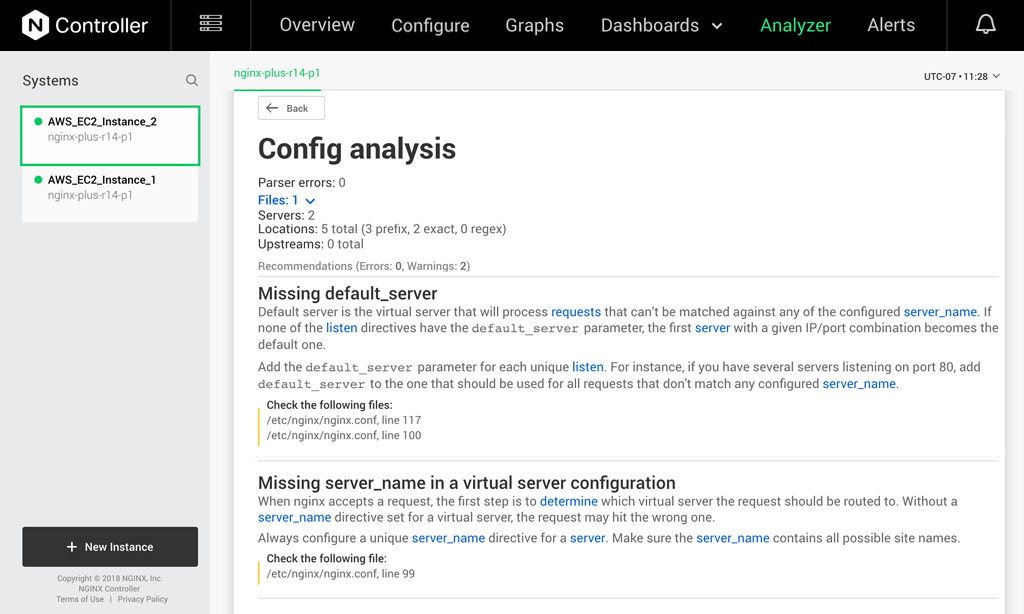
This figure shows two specific misconfigurations for the AWS-EC2_Instance_2 NGINX Plus instance. This configuration is missing the default_server and server_name directives. Analyzer also provides guidance on how to resolve these issues.
Instance Inventory
This view facilitates a quick audit of all your NGINX Plus instances. You can track the status and software version of all your NGINX Plus instances. You can filter this view by hostname, uptime, or system metrics such as CPU usage and memory usage.
Multi-Cloud Support
NGINX Controller is delivered as a Docker package. Docker offers complete flexibility in terms of deployment. You can deploy Controller in any environment that supports Docker containers – be it private or public cloud, virtual machines, or bare metal – to manage NGINX Plus instances operating across a multi‑cloud environment.
Rest API
All performance and health metrics can be exported via the NGINX Controller REST API for seamless integration with any monitoring tool. Upon providing the application name, and redirect URIs, an API key gets generated. A monitoring application can use the API key to extract NGINX Plus performance metrics.
Conclusion
NGINX Controller makes your NGINX Plus deployment more effective and easier to manage. Attend our upcoming webinar to get an in‑depth look at and demo of NGINX Controller. Watch our video to see a quick overview of NGINX Controller. And attend NGINX Conf 2018 to learn more about the past, present, and future of NGINX Controller.