

Editor – You can download the latest plug‑in for displaying metrics from NGINX Open Source and NGINX Plus in New Relic at https://github.com/nginxinc/new-relic-agent.
NGINX no longer provides free support for this plug‑in. For information about support options, please refer to our Support page.
This post has been updated to refer to the NGINX Plus API, which replaces and deprecates the separate status module mentioned in the original version of the post.
In March, 2013 we released the first version of the “nginx web server” plug‑in for New Relic monitoring of NGINX Open Source and NGINX Plus. Since then, we’ve received lots of interest from users – we greatly appreciate it! The plug‑in continues to be one of the most popular New Relic plug‑ins, in spite of the few things that (we believe!) could be improved. If you don’t already have a New Relic account, sign up as a NewRelic “Friend with benefits”.
We selected Ruby as the base language for the original plug‑in, because the New Relic platform itself is written in Ruby, the API was not yet published, and many things were changing quickly.
Later, after the launch of the New Relic platform, we continued to work on adding a number of improvements based on users’ feedback and our own vision of how to improve the overall usability of the NGINX monitoring plug‑in, and realized the need for further changes.
What’s New?
Today, we are pleased to announce a major update of the NGINX plug‑in for New Relic, version 2.0, which includes the following changes:
- The plug‑in is rewritten in Python. You no longer need to install Ruby.
- The plug‑in is finally packaged. There are prebuilt packages for RHEL/CentOS‑based and Debian/Ubuntu‑based systems. An included init script enables you to easily set up autostart of the plug‑in.
-
There are two new sections in the live activity monitoring dashboard, for NGINX Plus customers:
- Servers – Additional summary counters for virtual servers whose
serverconfiguration block includes thestatus_zonedirective - Cache – Cumulative stats for all configured caches
- Servers – Additional summary counters for virtual servers whose
- Verbose logging is enabled by default.
Installation
Download the plug‑in and installation instructions.
Configuring the Plug‑In
The configuration file for the NGINX plug‑in is /etc/nginx-nr-agent/nginx-nr-agent.ini. The minimal configuration includes:
-
Your New Relic license key in the
newrelic_license_keystatement in theglobalsection. -
At least one
sourcesection. The name of the section is used in log entries only, and can contain almost any character string you want. Two parameters are required:name– NGINX instance name in the New Relic UI.url– Full URL to the corresponding instance. The plug‑in accepts source data in the format generated when thestub_statusdirective is included in the configuration of NGINX or NGINX Plus. It also supports the JSON‑formatted output generated when theapidirective is included in an NGINX Plus configuration.
You can include the optional http_user and http_pass statements to set HTTP basic authentication credentials in cases where the corresponding location is protected by the NGINX auth_basic directive.
The default log file is /var/log/nginx-nr-agent.log.
Running the Plug‑In
You can manage the plug‑in with an init script. Run the service nginx-nr-agent command with the start, stop, or status argument to start, stop, or display the status of the plug‑in, respectively.
When started from an init script, the plug‑in daemon runs as the nobody user.
You can start the plug‑in directly by running /usr/bin/nginx-nr-agent.py, with the following optional parameters:
-c,--config– Path to configuration file-p,--pidfile– Path to PID file-f,--foreground– Do not detach from terminal (useful for debugging)
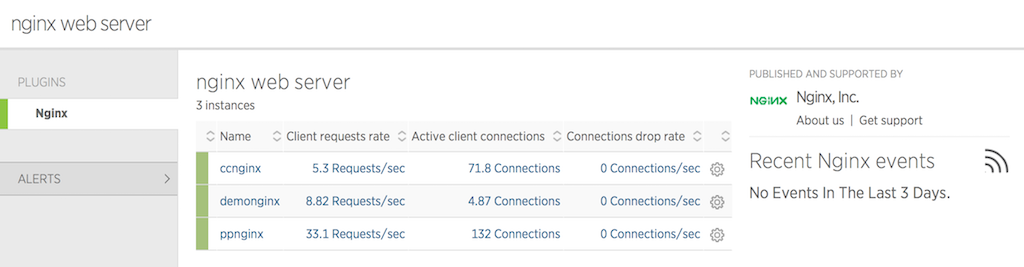
If everything is working as expected, the plug‑in appears as a tab in the New Relic UI:
Dashboard Examples
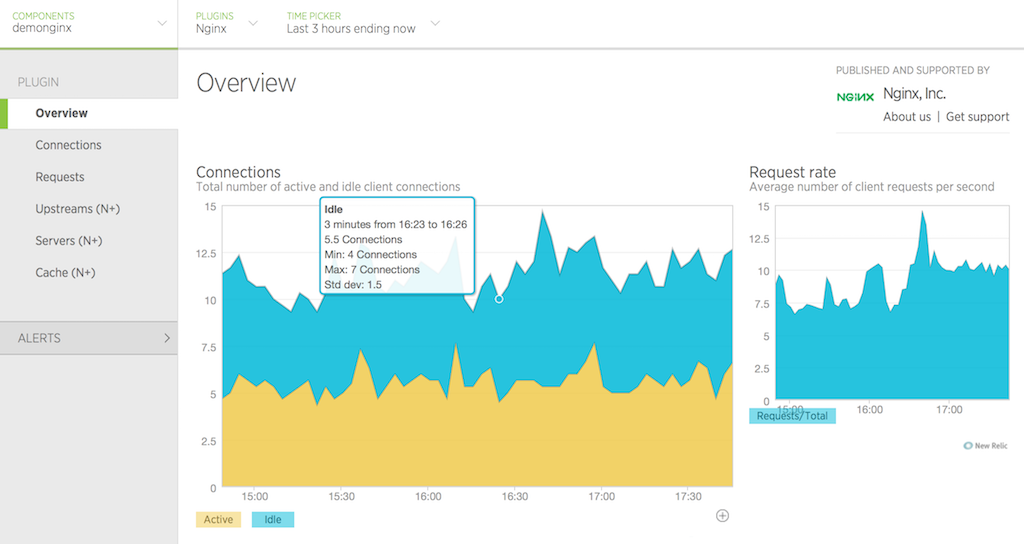
Overview
The Overview tab displays the most basic metrics for the whole instance: number of active and idle connections, and request rate.
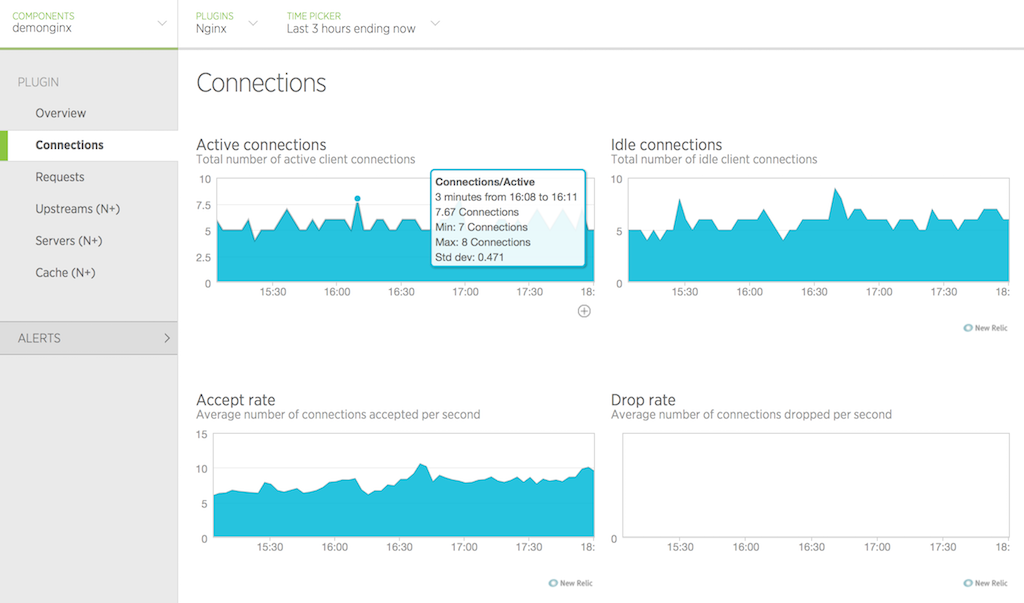
Connections
The Connections tab displays various metrics about client connections.
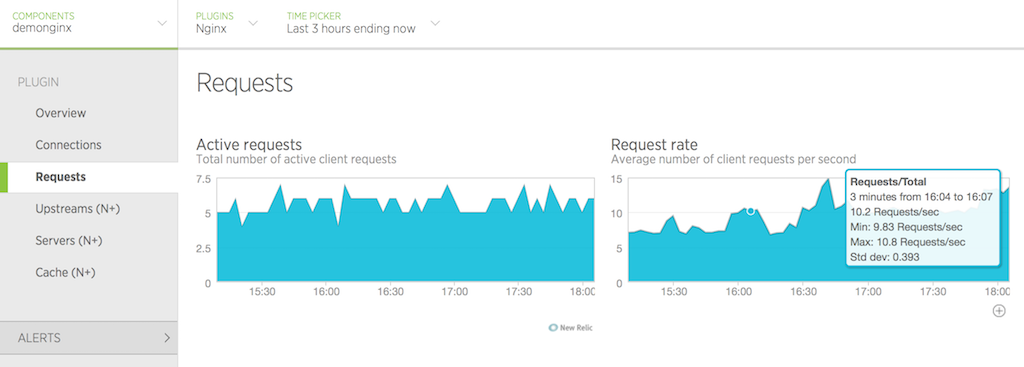
Requests
The Requests tab displays the number of requests currently being processed and the overall request rate.
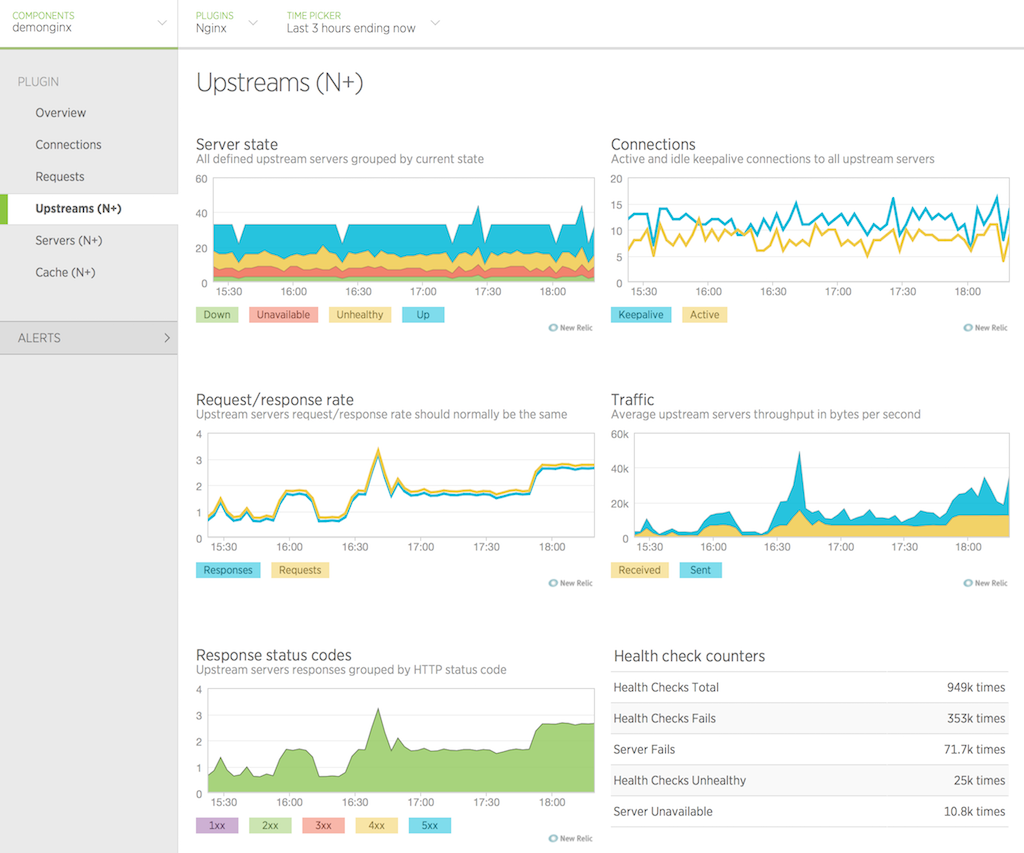
Upstreams (NGINX Plus only)
The Upstreams tab displays detailed statistics about all configured upstream groups.
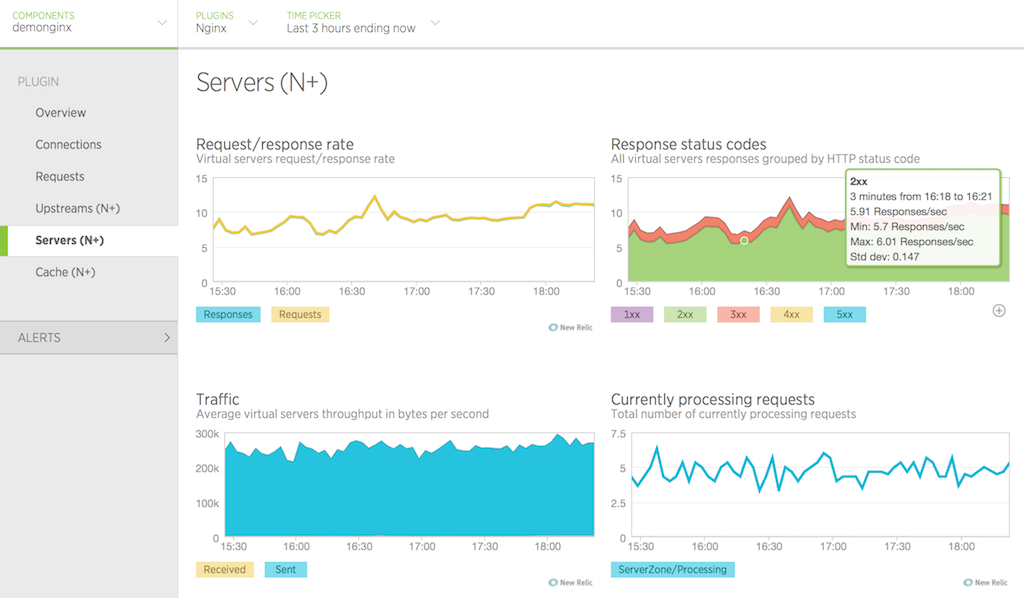
Servers (NGINX Plus only)
The Servers tab displays detailed statistics about all configured virtual server zones.
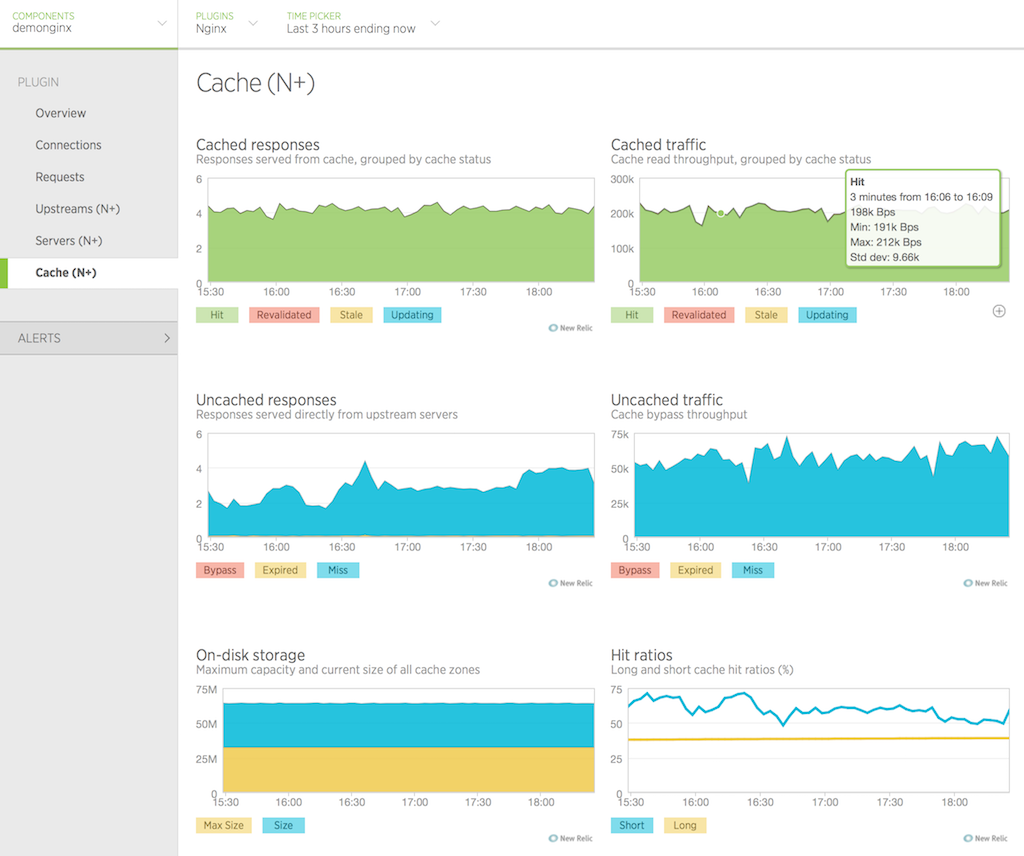
Cache (NGINX Plus only)
The Cache tab displays summary statistics for all configured caches.
What’s Next?
We plan to extend the plug‑in’s functionality with additional metrics for both NGINX and NGINX Plus, and your feedback is very important to us. Ideas, thoughts, questions? Let us know by commenting on this post.
Thanks for using NGINX and NGINX Plus!
To try NGINX Plus, start your free 30-day trial today or contact us to discuss your use cases.