面向 NGINX 和 NGINX Plus 的 OpenTracing

尽管微服务架构有诸多优势,但它也带来了新的挑战。其中一个挑战是在处理请求时对其进行追踪,因为请求数据在组成应用的所有微服务之间流动。为此,一种被称为分布式(请求)追踪的新方法用来解决这一挑战, OpenTracing 供一组规范和标准的 API,旨在指导分布式追踪工具的设计和实施。
在 NGINX Plus Release 18 (R18) 中,NGINX 官方将 NGINX OpenTracing 模块添加到 NGINX Plus 动态模块库中(它已经作为第三方模块被使用了数年)。NGINX OpenTracing 模块的一大优势是,通过对 NGINX 和 NGINX Plus 进行分布式追踪,您可以获得每个代理应用的追踪数据,而无需单独对应用进行追踪。
在这篇博客中,我们将展示如何为 NGINX 或 NGINX Plus 启用分布式请求追踪(为简洁起见,我们从现在起只提及 NGINX Plus)。我们将讨论两个分布式追踪服务(在 OpenTracing 术语中为“追踪器 [tracer]”) — Jaeger 和 Zipkin。(关于其他追踪器的列表,请见 OpenTracing 文档)。为了说明追踪器提供的信息类型,我们比较了启用 NGINX Plus 缓存前后的请求处理。
追踪器有两个基本组件:
- 一个是代理,用于从运行应用的主机上收集跟踪数据。在我们的示例中,“应用”是 NGINX Plus,代理作为插件
- 一个是服务器(也称为“收集器”),它接受来自一个或多个代理的追踪数据,并在一个集中的用户界面上显示。您可以选择在 NGINX Plus 主机或其他主机上运行服务器。
安装追踪器服务器
第一步是根据您选择的追踪器在服务器上进行安装和配置服。我们现在为 Jaeger 和 Zipkin 提供说明;对其他追踪器则根据需要进行调整。
安装 Jaeger 服务器
我们建议使用以下方法安装 Jaeger 服务器。您也可以在步骤 1 中指定的 URL 下载 Docker 镜像。
导航到 Jaeger 下载页面并下载 Linux 二进制文件(在编写本文时,jaeger-1.12.0-linux-amd64.tar)。
解压二进制文件运行,或将二进制文件移到 /usr/bin 目录,然后运行。
$ mkdir /usr/bin/jaeger$ mv jaeger-1.12.0-linux-amd64.tar /usr/bin/jaeger
$ cd /usr/bin/jaeger
$ tar xvzf jaeger-1.12.0-linux-amd64.tar.gz
$ sudo rm -rf jaeger-1.12.0-linux-amd64.tar.gz
$ cd jaeger-1.12.0-linux-amd64
$ ./jaeger-all-in-one
验证您能否在浏览器中访问 Jaeger UI,访问地址为 http://Jaeger-server-IP-address:16686/(16686 是 Jaeger 服务器的默认端口)。
安装 Zipkin 服务器
下载并运行 Zipkin 的 Docker 镜像(我们使用默认端口 9411)。
$ docker run -d -p 9411:9411 openzipkin/zipkin-
验证您能否在浏览器中访问 Zipkin Ui,访问地址为 http://Zipkin-server-IP-address:9411/。
安装和配置追踪器插件
在 NGINX Plus 主机上运行这些命令,为 Jaeger 或 Zipkin 安装插件。
安装 Jaeger 插件
-
安装 Jaeger 插件。以下 wget 命令适用于 x86‑64 Linux 系统:
$ cd /usr/local/lib
$ wget https://github.com/jaegertracing/jaeger-client-cpp/releases/download/v0.4.2/libjaegertracing_plugin.linux_amd64.so -O /usr/local/lib/libjaegertracing_plugin.so
GitHub 上提供了从源代码构建插件的说明。
为插件创建一个 JSON 格式的配置文件,命名为 /etc/jaeger/jaeger-config.json,内容如下。我们使用 Jaeger 服务器的默认端口 6831:
{  "service_name": "nginx",
  "sampler": {
    "type": "const",
    "param": 1
  },
  "reporter": {
    "localAgentHostPort": "Jaeger-server-IP-address:6831"
  }
}
有关采样器对象的详细信息,请参见 Jaeger 文档。
安装 Zipkin 插件
安装 Zipkin 插件。以下
wget命令适用于 x86‑64 Linux 系统:$ cd /usr/local/lib$ wget -O - https://github.com/rnburn/zipkin-cpp-opentracing/releases/download/v0.5.2/linux-amd64-libzipkin_opentracing_plugin.so.gz | gunzip -c > /usr/local/lib/libzipkin_opentracing_plugin.so为插件创建一个 JSON 格式的配置文件,命名为 /etc/zipkin/zipkin-config.json,内容如下。我们使用 Zipkin 服务器的默认端口 9411:
{  "service_name": "nginx",
  "collector_host": "Zipkin-server-IP-address",
  "collector_port": 9411
}
有关配置对象的详细信息,请参阅 GitHub 上的 JSON 模式。
配置 NGINX Plus
在 NGINX Plus 主机上执行以下操作步骤。
根据 NGINX Plus 管理指南中的说明安装 NGINX OpenTracing 模块。
在主 NGINX Plus 配置文件 (/etc/nginx/nginx.conf) 的主(顶层)上下文中添加以下
load_module指令:load_module modules/ngx_http_opentracing_module.so;-
将以下指令添加到 NGINX Plus 配置中。
如果您使用传统的配置方案,请将指令放在一个名为 /etc/nginx/conf.d/opentracing.conf 的新文件中。同时验证以下
include指令已经出现在 /etc/nginx/nginx.conf 的http上下文中:http { include /etc/nginx/conf.d/*.conf; }opentracing_load_tracer指令启用追踪器插件。根据需要取消 Jaeger 或 Zipkin 的指令注释。Opentracing_tag指令将 NGINX Plus 变量作为 opentracing 标记显示在追踪器 UI 中。- 要调试 OpenTracing 活动,请取消
log_format和access_log指令的注释。如果要将默认的 NGINX 访问日志和日志格式替换为此格式,请取消注释这些指令,然后将 “opentracing” 的三个实例更改为 “main” 。另一个选项是仅针对 9001 端口上的流量记录 OpenTracing 活动 — 取消log_format和access_log指令的注释,并将它们移动到服务器块中。 服务器块为下一节中描述的 Ruby 示例应用设置 OpenTracing。
# Load a vendor tracer#opentracing_load_tracer /usr/local/libjaegertracing_plugin.so
#                        /etc/jaeger/jaeger-config.json;
#opentracing_load_tracer /usr/local/lib/libzipkin_opentracing_plugin.so
#                        /etc/zipkin/zipkin-config.json;

# Enable tracing for all requests
opentracing on;

# Set additional tags that capture the value of NGINX Plus variables
opentracing_tag bytes_sent $bytes_sent;
opentracing_tag http_user_agent $http_user_agent;
opentracing_tag request_time $request_time;
opentracing_tag upstream_addr $upstream_addr;
opentracing_tag upstream_bytes_received $upstream_bytes_received;
opentracing_tag upstream_cache_status $upstream_cache_status;
opentracing_tag upstream_connect_time $upstream_connect_time;
opentracing_tag upstream_header_time $upstream_header_time;
opentracing_tag upstream_queue_time $upstream_queue_time;
opentracing_tag upstream_response_time $upstream_response_time;

#uncomment for debugging
# log_format opentracing '$remote_addr - $remote_user [$time_local] "$request" '
#                        '$status $body_bytes_sent "$http_referer" '
#                        '"$http_user_agent" "$http_x_forwarded_for" '
#                        '"$host" sn="$server_name" '
#                        'rt=$request_time '
#                        'ua="$upstream_addr" us="$upstream_status" '
#                        'ut="$upstream_response_time" ul="$upstream_response_length" '
#                        'cs=$upstream_cache_status';
#access_log /var/log/nginx/opentracing.log opentracing;

server {
    listen 9001;

    location / {
        # The operation name used for OpenTracing Spans defaults to the name of the
        # 'location' block, but uncomment this directive to customize it.
        #opentracing_operation_name $uri;

        # Propagate the active Span context upstream, so that the trace can be
        # continued by the backend.
        opentracing_propagate_context;

        # Make sure that your Ruby app is listening on port 4567
        proxy_pass http://127.0.0.1:4567;
    }
}
验证并重新加载 NGINX Plus 配置:
$ nginx -t$ nginx -s reload
设置 Ruby 示例应用
完成追踪器和 NGINX Plus 配置后,我们就创建了一个 Ruby 示例应用,可用来做 OpenTracing 数据展示。该应用可以让我们测量 NGINX Plus 缓存在多大程度上改善了响应时间。当应用收到请求时,比如下面对根路径/的 HTTP GET 请求,它会随机等待一段时间(2 到 5 秒之间),然后做出响应。
$ curl http://NGINX-Plus-IP-address:9001/-
安装和设置 Ruby 和 Sinatra(一种开源软件 web 应用框架和用 Ruby 编写的特定领域语言,可以替代其他 Ruby web 应用框架)。
-
创建一个名为 app.rb 的文件,内容如下:
#!/usr/bin/ruby

require 'sinatra'

get '/*' do
    out = "<h1>Ruby simple app</h1>" + "\n"

    #Sleep a random time between 2s and 5s
    sleeping_time = rand(4)+2
    sleep(sleeping_time)
    puts "slept for: #{sleeping_time}s."
    out += '<p>some output text</p>' + "\n"

    return out
end
对 app.rb 文件添加可执行权限并运行:
$ chmod +x app.rb$ ./app.rb
无缓存追踪响应时间
本部分使用 Jaeger 和 Zipkin 来显示未启用缓存时,NGINX Plus 响应请求所需的时间。对于每个追踪器,我们发送五个请求。
Jaeger 无缓存输出
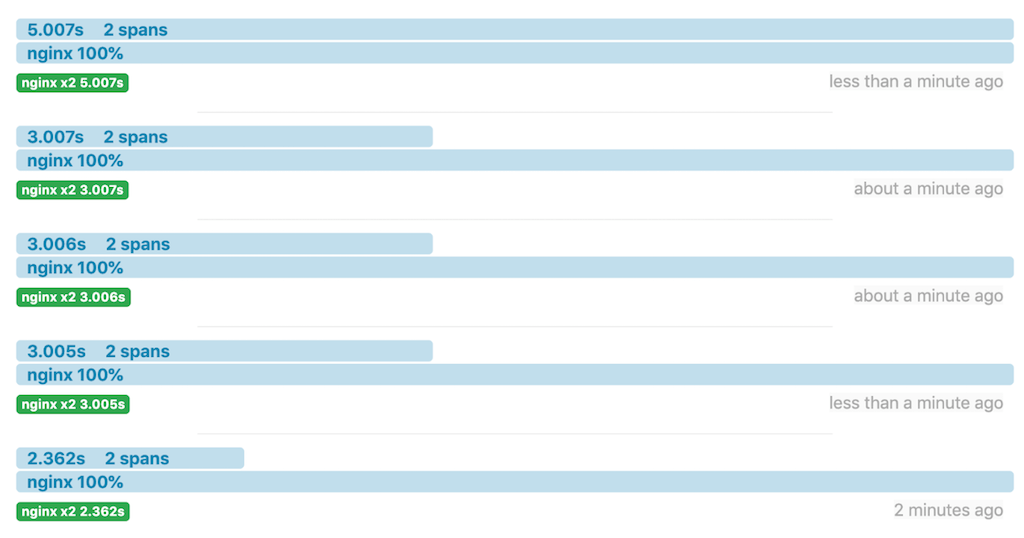
以下是 Jaeger UI 中显示的五个请求(最近的排第一):

以下是 Ruby 应用控制台上的相同信息:
- -> /slept for: 3s.
127.0.0.1 - - [07/Jun/2019: 10:50:46 +0000] "GET / HTTP/1.1" 200 49 3.0028
127.0.0.1 - - [07/Jun/2019: 10:50:43 UTC] "GET / HTTP/1.0" 200 49
- -> /
slept for: 2s.
127.0.0.1 - - [07/Jun/2019: 10:50:56 +0000] "GET / HTTP/1.1" 200 49 2.0018
127.0.0.1 - - [07/Jun/2019: 10:50:54 UTC] "GET / HTTP/1.0"1 200 49
- -> /
slept for: 3s.
127.0.0.1 - - [07/Jun/2019: 10:53:16 +0000] "GET / HTTP/1.1" 200 49 3.0029
127.0.0.1 - - [07/Jun/2019: 10:53:13 UTC] "GET / HTTP/1.0" 200 49
- -> /
slept for: 4s.
127.0.0.1 - - [07/Jun/2019: 10:54:03 +0000] "GET / HTTP/1.1" 200 49 4.0030
127.0.0.1 - - [07/Jun/2019: 10:53:59 UTC] "GET / HTTP/1.0" 200 49
- -> /
slept for: 3s.
127.0.0.1 - - [07/Jun/2019: 10:54:11 +0000] "GET / HTTP/1.1" 200 49 3.0012
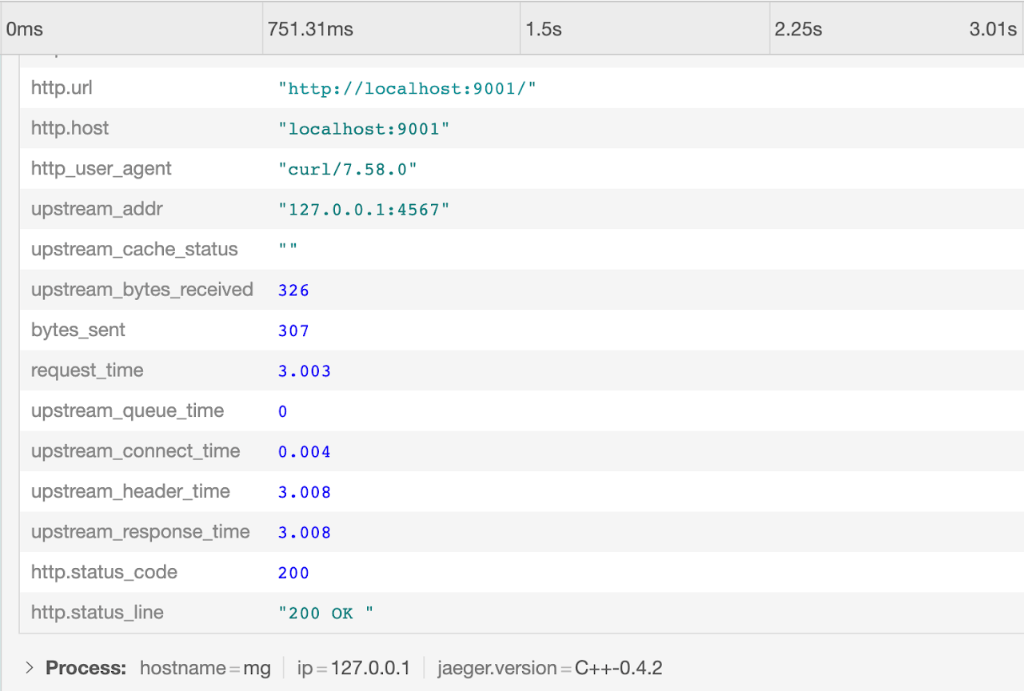
127.0.0.1 - - [07/Jun/2019: 10:54:08 UTC] "GET / HTTP/1.0" 200 49在 Jaeger UI 中,我们点击第一个(最近的)请求来查看其详细信息,包括我们作为标签添加的 NGINX Plus 变量的值:
Zipkin 无缓存输出
以下是 Zipkin UI 中的五个请求:
Ruby 应用控制台中的相同信息:
- -> /slept for: 2s.
127.0.0.1 - - [07/Jun/2019: 10:31:18 +0000] "GET / HTTP/1.1" 200 49 2.0021
127.0.0.1 - - [07/Jun/2019: 10:31:16 UTC] "GET / HTTP/1.0" 200 49
- -> /
slept for: 3s.
127.0.0.1 - - [07/Jun/2019: 10:31:50 +0000] "GET / HTTP/1.1" 200 49 3.0029
127.0.0.1 - - [07/Jun/2019: 10:31:47 UTC] "GET / HTTP/1.0" 200 49
- -> /
slept for: 3s.
127.0.0.1 - - [07/Jun/2019: 10:32:08 +0000] "GET / HTTP/1.1" 200 49 3.0026
127.0.0.1 - - [07/Jun/2019: 10:32:05 UTC] "GET / HTTP/1.0" 200 49
- -> /
slept for: 3s.
127.0.0.1 - - [07/Jun/2019: 10:32:32 +0000] "GET / HTTP/1.1" 200 49 3.0015
127.0.0.1 - - [07/Jun/2019: 10:32:29 UTC] "GET / HTTP/1.0" 200 49
- -> /
slept for: 5s.
127.0.0.1 - - [07/Jun/2019: 10:32:52 +0000] "GET / HTTP/1.1" 200 49 5.0030
127.0.0.1 - - [07/Jun/2019: 10:32:47 UTC] "GET / HTTP/1.0" 200 49
在 Zipkin UI 中,我们点击第一个请求来查看其详细信息,包括我们作为标签添加的 NGINX Plus 变量的值:

使用缓存追踪响应时间
配置 NGINX Plus 缓存
本部分通过在“配置 NGINX Plus” 部分创建的 opentracing.conf 文件中添加指令来启用缓存。
在
http上下文中,添加此proxy_cache_path指令:proxy_cache_path /data/nginx/cache keys_zone=one:10m;-
在服务器块中,添加以下
proxy_cache和proxy_cache_valid指令:proxy_cache one; proxy_cache_valid any 1m; 验证并重新加载配置:
$ nginx -t$ nginx -s reload
带缓存的 Jaeger 输出
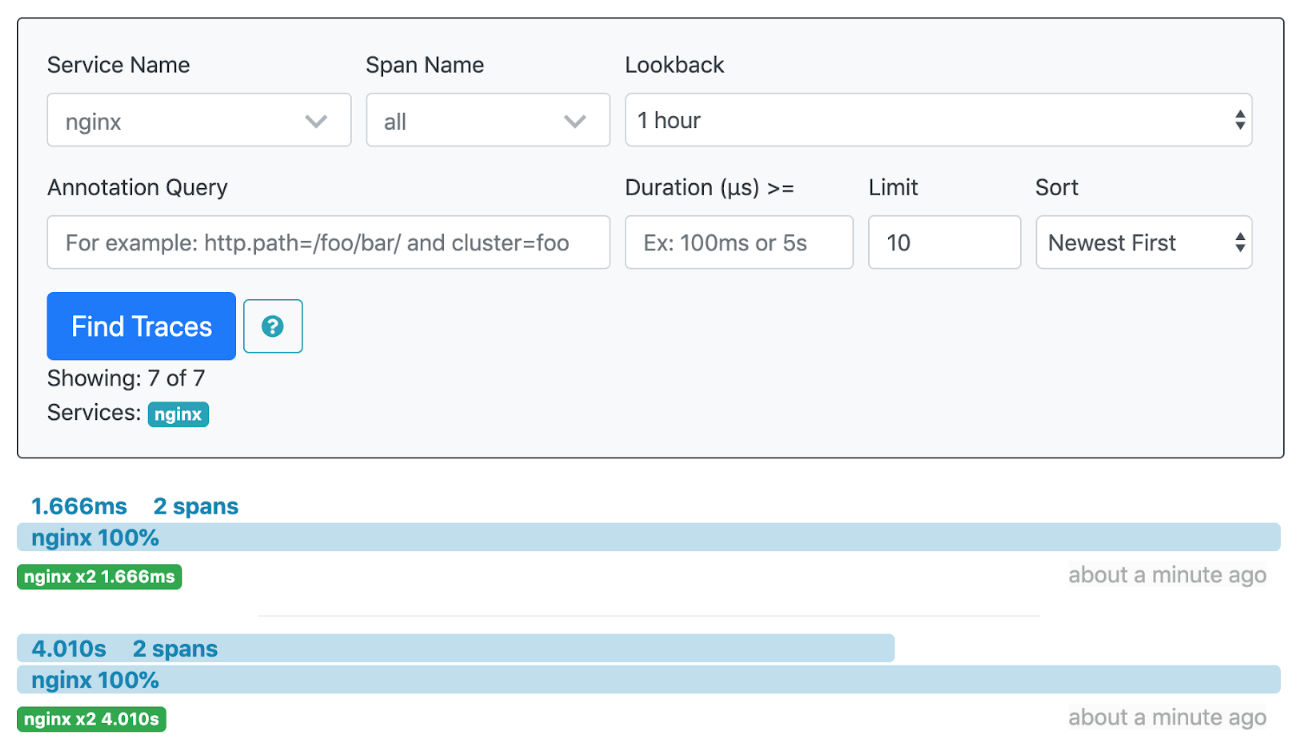
这是两个请求后的 Jaeger UI。

第一次响应(标记为 13f69db)耗时 4 秒。NGINX Plus 缓存了响应,当请求在大约 15 秒后重复时,响应花费了不到 2 毫秒 (ms) ,因为它来自 NGINX Plus 缓存。
详细查看这两个请求可以解释响应时间的差异。对于第一个请求,upstream_cache_status 是 MISS,意味着请求的数据不在缓存中。Ruby 应用增加了 4 秒的延迟。

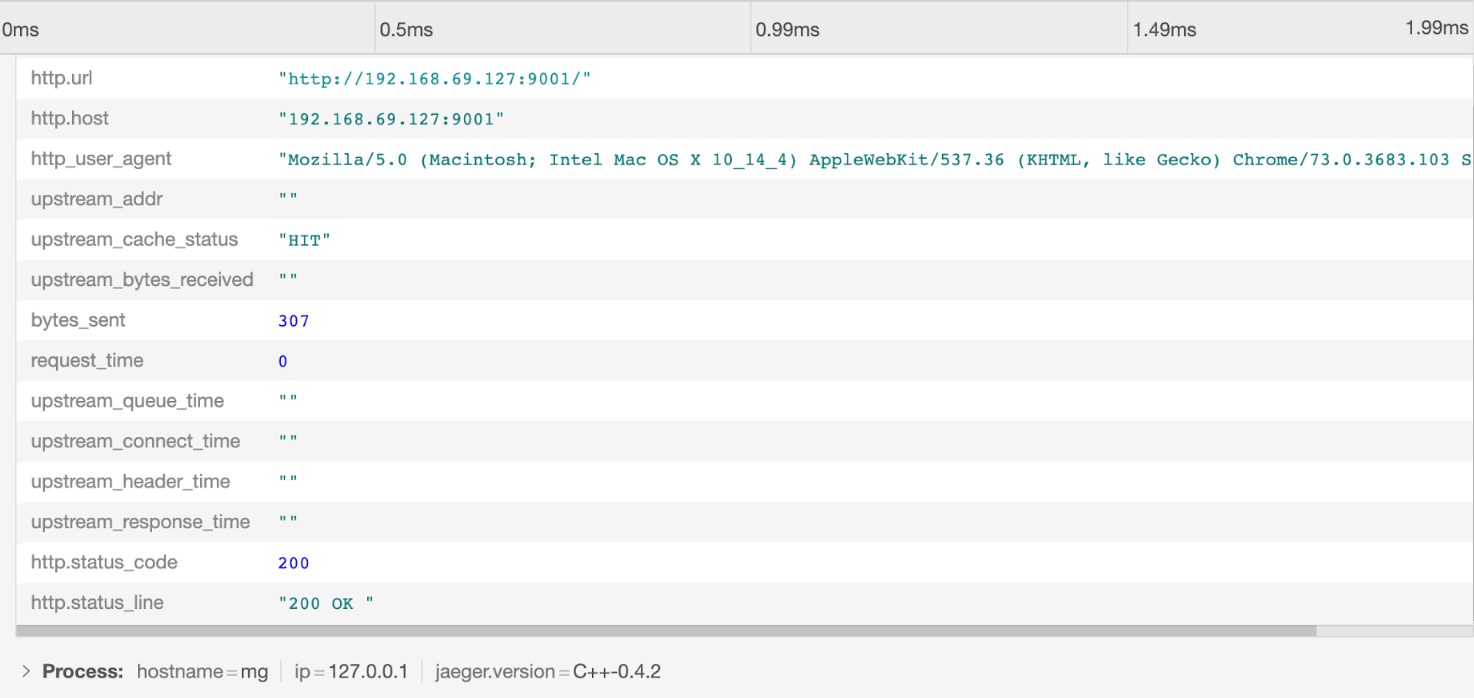
对于第二个请求,upstream_cache_status 是 HIT。因为数据来自于缓存,Ruby 应用无法添加延迟,响应时间低于 2 毫秒。空的 upstream_* 值也表示上游服务器没有参与此响应。
带缓存的 Zipkin 输出
启用缓存的两个请求在 Zipkin UI 中呈现出类似的结果:
详细查看这两个请求可以解释响应时间的差异。第一个请求没有缓存响应(upstream_cache_status 为 MISS),Ruby 应用(巧合)添加了与 Jaeger 示例相同的 4 秒延迟。

在我们发出第二个请求之前,响应已经被缓存,因此 upstream_cache_status 是 HIT。

结语
NGINX OpenTracing 模块支持对 NGINX Plus 请求和响应的追踪,并使用 OpenTracing 标记提供对 NGINX Plus 变量的访问。此模块还可以使用不同的追踪器。
关于 NGINX OpenTracing 模块的更多详细信息,请访问 GitHub 上的 NGINX OpenTracing 模块存储库。
如欲试用 OpenTracing with NGINX Plus,请立即下载 30 天免费试用版,或与我们联系以讨论您的用例。
"This blog post may reference products that are no longer available and/or no longer supported. For the most current information about available F5 NGINX products and solutions, explore our NGINX product family. NGINX is now part of F5. All previous NGINX.com links will redirect to similar NGINX content on F5.com."