监测 NGINX
Setting up a monitoring tool for NGINX is an important part of maintaining website operations. Proper NGINX monitoring can reveal a lot of useful information about the underlying application performance. There are quite a few monitoring systems out there suitable for the task; the first step, however, is to enable metric collection in NGINX.
Using the stub_status Module
There’s a module for NGINX Open Source called ngx_http_stub_status_module (or simply stub_status) that exposes a few important metrics about NGINX activity.
To check if your NGINX build has the stub_status module, run nginx -V:
$ nginx -V 2>&1 | grep --color -- --with-http_stub_status_moduleAll of our NGINX builds include the stub_status module on all supported platforms.
If your NGINX build does not include the stub_status module, you have to rebuild from source and include the --with-http_stub_status_module parameter to the configure script.
As the next step, enable the module in your NGINX configuration by including the stub_status directive in a location block. You can always add the block to an existing server configuration. Alternatively, add a separate server block, with a single specialized location for the stub_status directive, as here:
server {
    listen 127.0.0.1:80;
    server_name 127.0.0.1;

    location /nginx_status {
        stub_status;
    }
}
Appropriate server blocks for the stub_status directive are sometimes found outside of the main configuration file (nginx.conf). If you don’t see a suitable block in that file, search for additional configuration files which are typically included in nginx.conf.
We also recommend that you allow only authorized users to access the metrics, for example by including the allow and deny directives in the location or server block.
After the stub_status module is configured, don’t forget to reload the NGINX configuration (with the service nginx reload command, for example). You can read more about NGINX control signals here.
To display the stub_status metrics, make a curl query. The following is appropriate for the configuration shown above:
$ curl http://127.0.0.1/nginx_statusActive connections: 2
server accepts handled requests
 841845 841845 1631067
Reading: 0 Writing: 1 Waiting: 1
If this doesn’t work, check where the requests to /nginx_status are routed. In many cases, another server block can be the reason why you can’t access the stub_status metrics. To read more about these instance‑wide NGINX metrics, see the reference documentation .
With the stub_status module enabled in NGINX and working, you can proceed with the installation and configuration of your monitoring system of choice.
Log Files and syslog
The NGINX access log and error log contain a lot of useful information suitable for metric collection. You can use NGINX variables to fully customize the access log format. Certain monitoring tools can leverage NGINX log files for metric collection.
To meet various performance and security requirements, consider using the NGINX syslog capability. While log files are written to disk, syslog allows NGINX to send log data over a network protocol. For example, you can set up a dedicated Linux system to collect all of your log data from various NGINX instances.
For more information on logging, please refer to the NGINX Plus Admin Guide.
Monitoring NGINX with Amplify
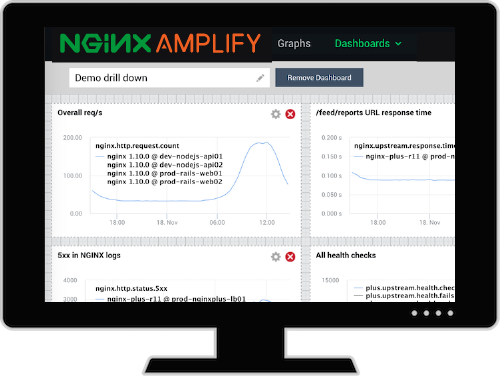
We have a native tool for NGINX monitoring. It’s called NGINX Amplify, and it’s a SaaS tool that you can use to monitor up to five servers for free (subscriptions are available for larger numbers of servers).
It’s easy to get started with NGINX Amplify. You can get out-of-the-box graphs for all key NGINX metrics in under ten minutes. NGINX Amplify automatically uses metrics from stub_status and from access logs, and can collect various OS information as well.
Using NGINX Amplify, you can visualize your NGINX performance, and monitor the OS, PHP‑FPM, Docker containers, and more. A unique feature in Amplify is a static analyzer for your NGINX configuration that provides recommendations for making the configuration more secure and efficient.
Read more about NGINX Amplify here, and try it out for free.

Additional API Module in NGINX Plus
NGINX Plus provides a better way to obtain performance metrics via a specialized API module.
The API module offers a detailed set of metrics, with the primary focus on load balancing and virtual server stats. As an example, a breakdown of all HTTP status codes (1xx, 2xx, 3xx, 4xx, 5xx) is presented for server blocks. Health status information is available for both HTTP and TCP/UDP upstream servers. Cache metrics include hits and misses for each cache zone.
Aside from gathering an extended set of metrics, the API also enables you to reconfigure HTTP and TCP/UDP upstream server groups and manage key‑value variables without reloading configuration or restarting NGINX Plus.
NGINX Plus also comes with an integrated dashboard that utilizes the additional metrics. The additional metrics are also available for use in NGINX Amplify.
Other Monitoring Solutions
A number of other monitoring products can collect and present NGINX metrics. The links below describe most common integration scenarios:
- The NGINX monitoring extension for AppDynamics
- Datadog‑NGINX integration
- NGINX monitoring with Dynatrace
- The NGINX plug‑in for New Relic
- The NGINX plug‑in for Pingdom Server Monitor
- Prometheus HTTP exporters and integrations
"This blog post may reference products that are no longer available and/or no longer supported. For the most current information about available F5 NGINX products and solutions, explore our NGINX product family. NGINX is now part of F5. All previous NGINX.com links will redirect to similar NGINX content on F5.com."
