


This blog post is one of six keynotes by NGINX team members from nginx.conf 2017. Together, these blog posts introduce the NGINX Application Platform, new products, and product and strategy updates.
The blog posts are:
- Speeding Innovation, Gus Robertson (video here)
- NGINX Product Roadmap, Owen Garrett (video here)
- Introducing NGINX Controller, Chris Stetson and Rachael Passov (video here)
- Introducing NGINX Unit, Igor Sysoev and Nick Shadrin (video here, in‑depth demo here, integration with the OpenShift Service Catalog here)
- The Future of Open Source at NGINX, Ed Robinson and Owen Garrett (video here)
- This post: NGINX Amplify is Generally Available, Owen Garrett (video here)
![]()
Owen Garrett: Thank you again. Wow! It’s been a fantastic conference.
As we close out our final keynote, I think you can be forgiven for wanting to catch your breath and just review what NGINX has been sharing this year at nginx.conf.
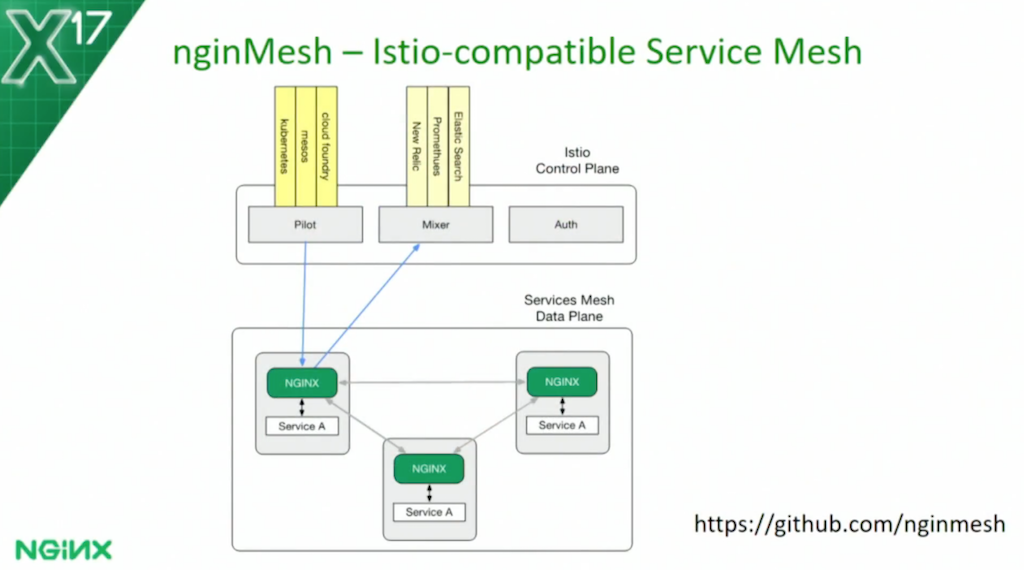
We talked to you about an open source project to integrate NGINX within the new Istio service mesh.
[Editor – NGINX is no longer developing or supporting the nginMesh project, which is now sponsored by the community. To learn about our current, free service mesh solution, visit NGINX Service Mesh. To learn about F5’s Istio‑based service mesh solution, visit Aspen Mesh.]
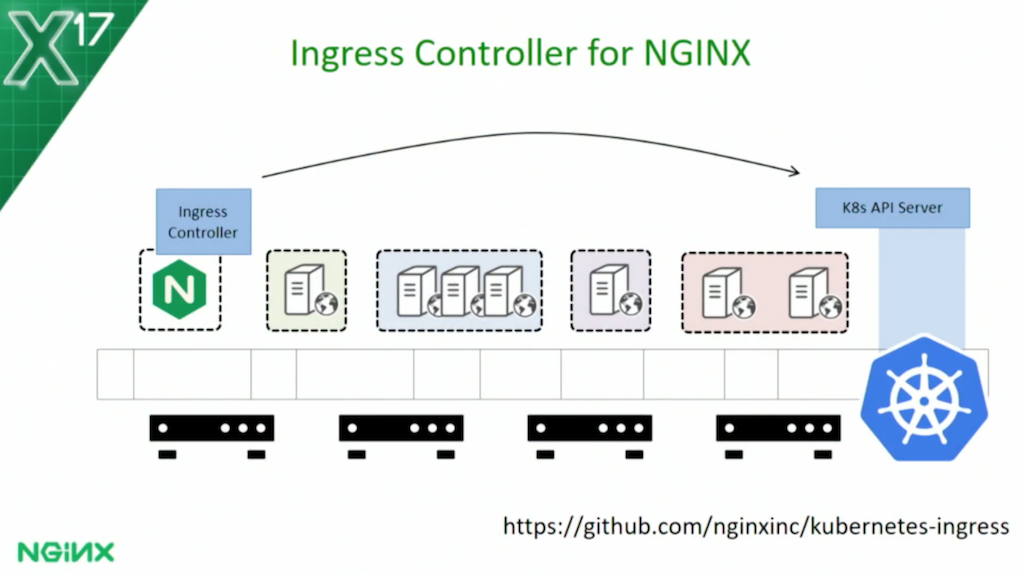
We talked about another open source project to build a fully supported Ingress controller implementation that will allow you to deploy load balancing rules from Kubernetes onto NGINX.
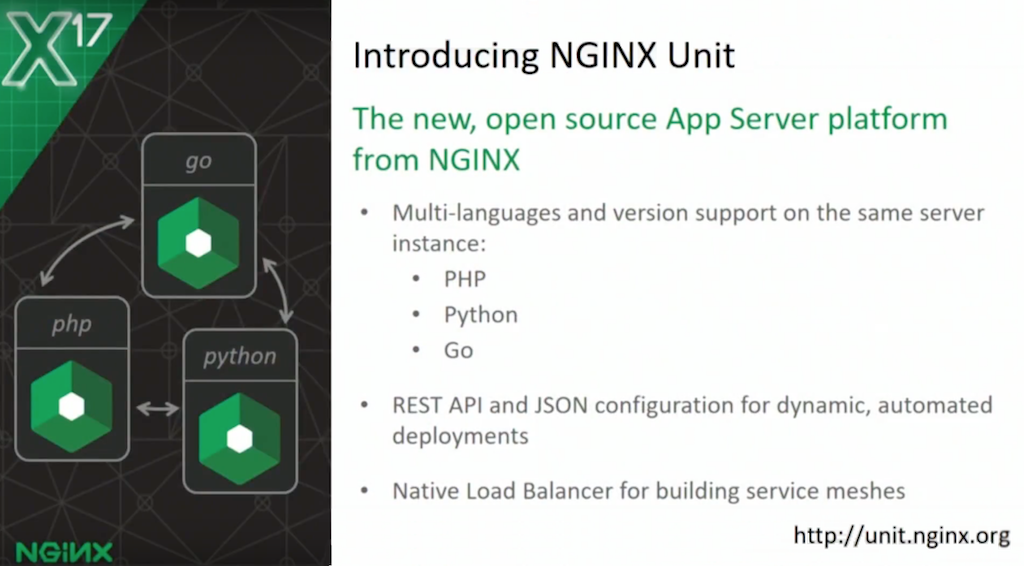
Of course, we took a deep dive and we learned from Nick Shadrin and Igor Sysoev about the vision, and the technology, and the future of a new web application platform: NGINX Unit.
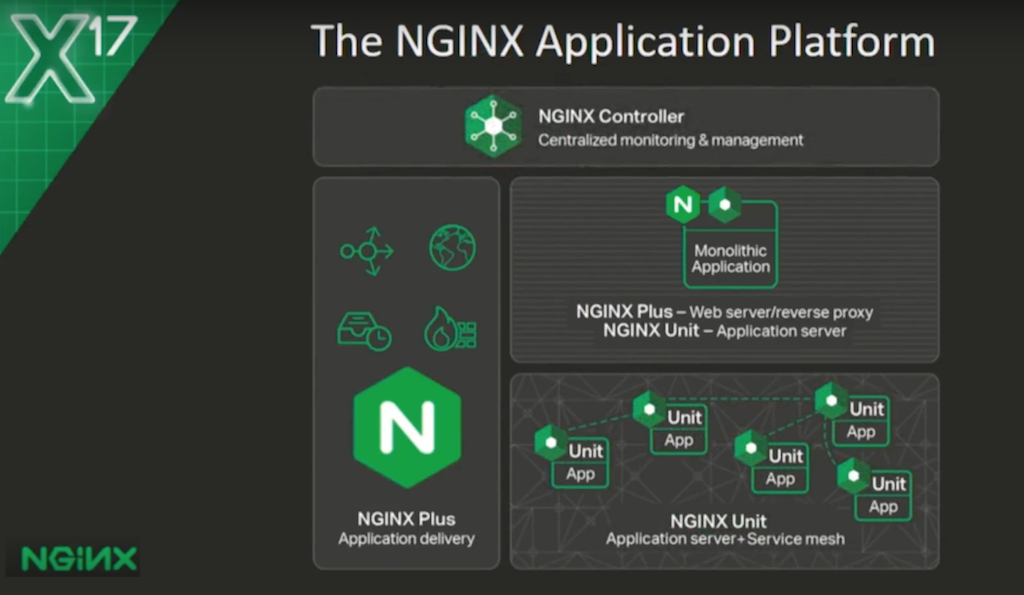
Yesterday, we talked about our vision for the NGINX Application Platform – how this suite of products comes together to build an autonomous, capable platform, managing your applications across a range of different deployment environments.
But, as ever, we like to hold one thing to the end. Today is about open source and about community. This is the most significant announcement that we have for our user community this year.
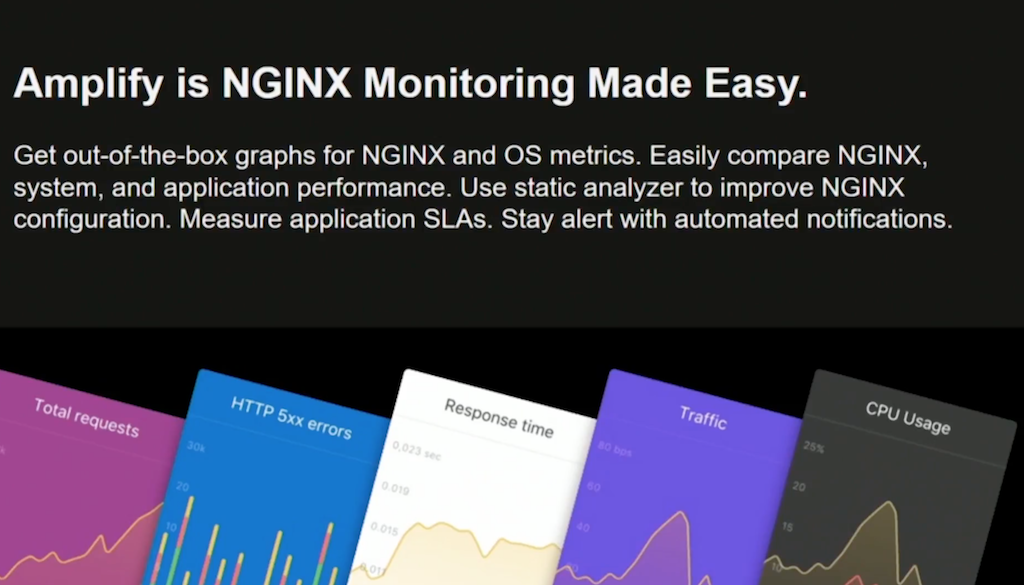
You may remember that we talked previously about a project: NGINX Amplify. Amplify is NGINX monitoring made easy. It’s out‑of‑the‑box graphs and charts for NGINX operating system metrics. It allows you to delve in and explore and compare NGINX application performance. It has a rich static analyzer that builds on the insights and expertise present in the core NGINX software, and gives that to you in an easy‑to‑understand way. It allows you to measure SLAs [service‑level agreements], monitor how your application is performing, and be alerted with automated notifications.
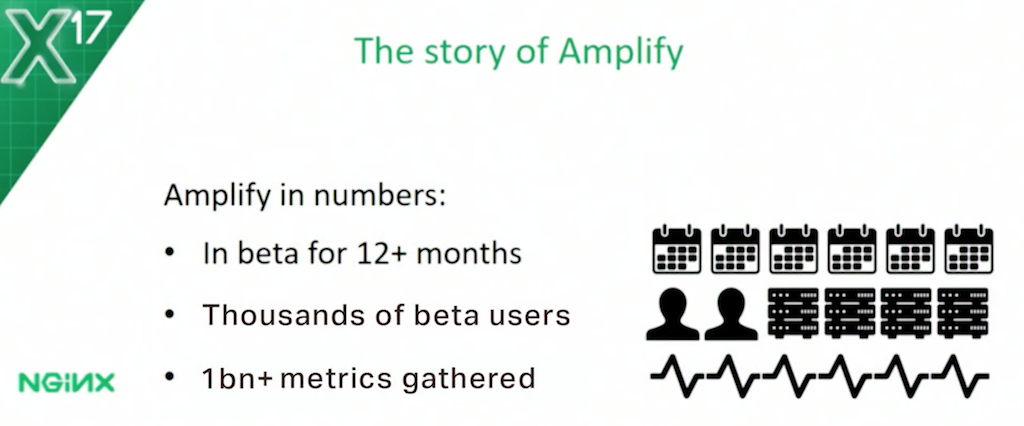
Amplify has been a long‑term project at NGINX. I remember when we first demonstrated this concept two years ago at our conference in San Francisco. It had been something we’d been considering for some time before then. But the project really only started when one of our founders, Andrew Alexeev, stepped up and made it happen. The Amplify project is a testament to his vision and his resolve.
What are the problems that Amplify solves? NGINX open source doesn’t offer good means for performance monitoring. The SaaS solutions that you can use as an alternative are very comprehensive, but they can be difficult to set up, or they’re not specifically tailored to give you the insight you need into NGINX metrics.
We wanted to share the huge amount of expertise in the NGINX team. We wanted to take you away from the Stack Overflow‑induced problem of doing copy‑and‑paste configuration and re‑implementing bad practices.
We wanted, as part of the monitoring solution, to give you alerting on abnormal behavior so you could identify problems proactively. But most importantly – the key value that goes above everything else in Amplify – was ease of use: the primary factor that defined what Amplify was and how you would use it.
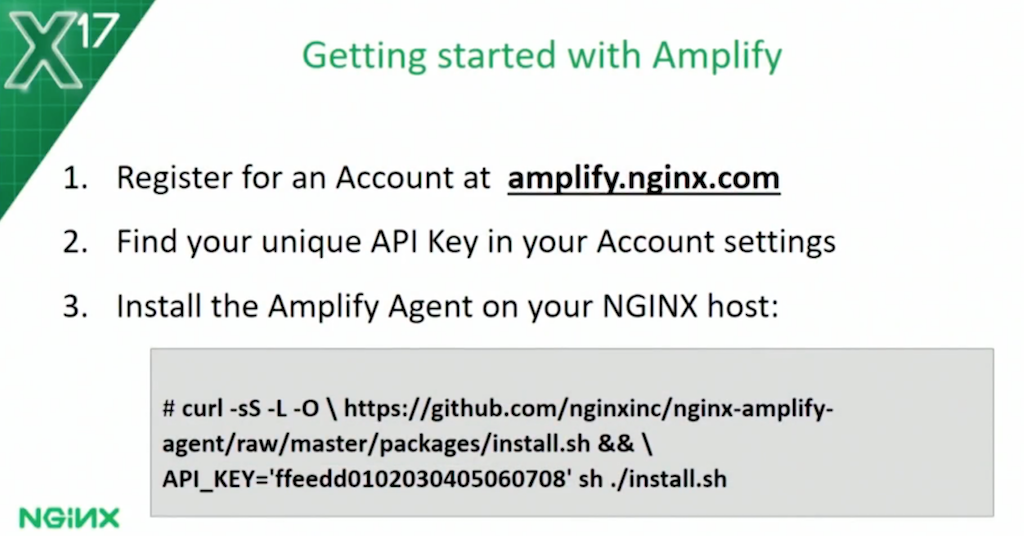
Getting started with Amplify is as easy as 1, 2, 3. Amplify is a SaaS‑based solution. Go and register for an account at amplify.nginx.com. Generates a unique API key for you, which you can find in your Account settings. Then install the Amplify Agent on your NGINX host; you can do that with a single command, as illustrated here.
The Agent is also provided for a range of different operating systems, with configuration scripts. If you were automating and industrializing the way that you deploy NGINX, you could then bring the Amplify package into that process. From that point on, your NGINX host will connect back to our SaaS service, and it will wait for instructions.

What does Amplify give you? Amplify gives you three really, really valuable capabilities:
- Monitoring and analytics, so you can understand what is happening
- Configuration insight
- Proactive alerting, so when an event happens or a particular threshold is met, you’re informed
Let’s look at each of these in turn.
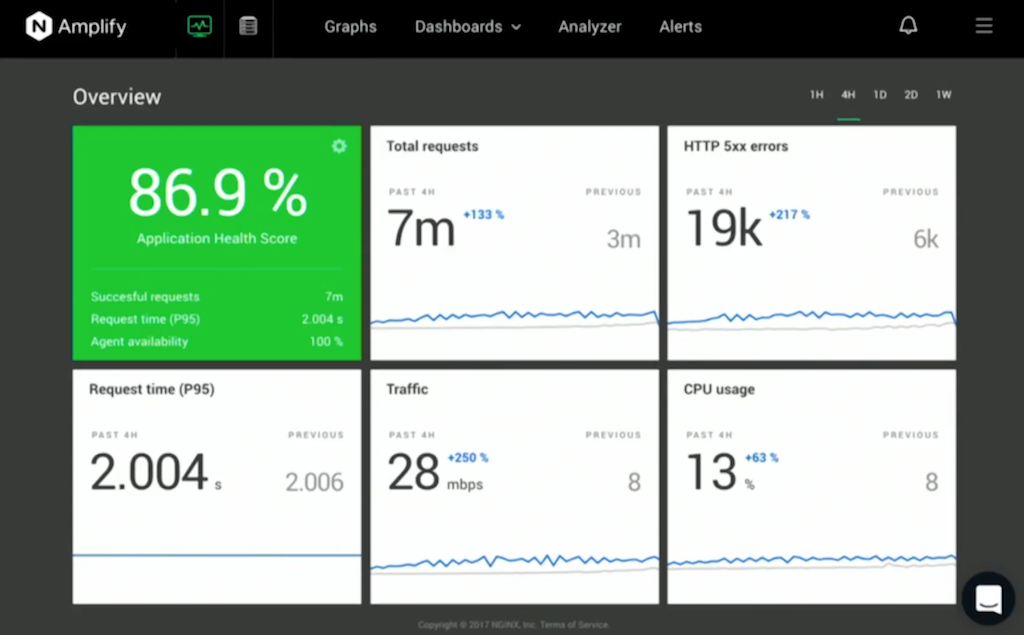
The monitoring and analytics start with the “God’s eye view” page. Internally, we call it the “Gus page” because Gus Robertson, our CEO, was the main driver behind adding it to Amplify. The purpose of this page is to give you a quick, one‑stop summary about the state of your NGINX infrastructure.
There are five overlay graphs for a time period that you can select. They monitor five key metrics for your system: requests, error rates, request time, traffic levels, CPU utilization.
You can very quickly do regression comparisons, choosing a time period – say, 24 hours – and comparing that to the previous 24 hours to see any anomalies. At the top left, the green block displays what we call the Application Health Score. This is a custom calculation – you can tune it if you wish – that takes a range of different metrics and applies them together to give you a green, orange, or red status for your application. It’s the easiest way to see if the system is running healthily.
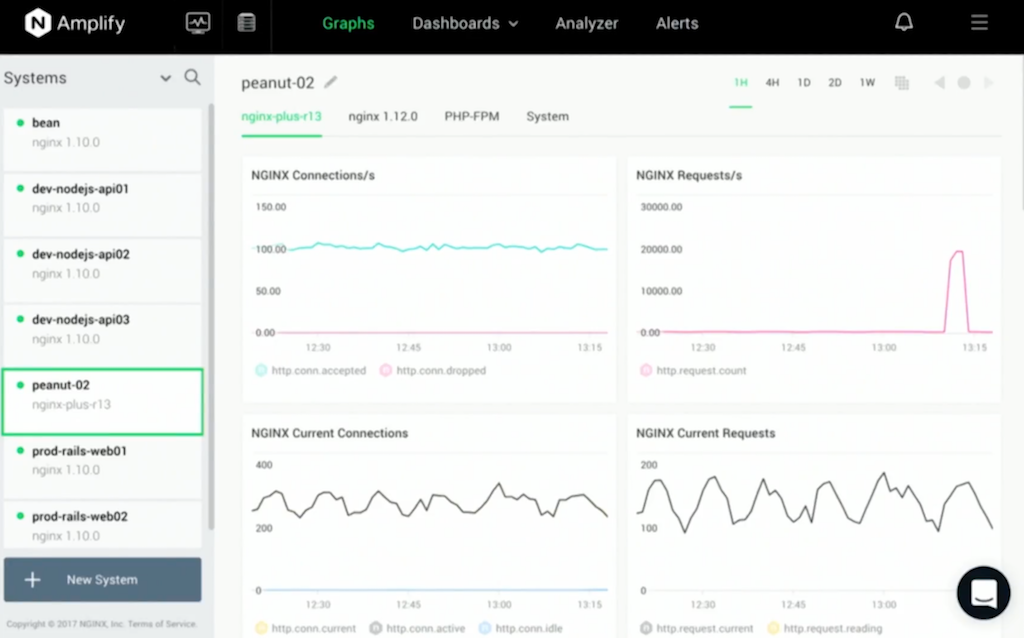
At its core is a data‑gathering, monitoring, and graphing engine. When you log in, you’ll be presented with a series of graphs. You get an overview of the key metrics – CPU, memory, disk utilization – drawn from operating system metrics.
We also pull in NGINX metrics. We interface with the HTTP Stub Status module [for NGINX OSS users] or the NGINX Plus Extended Status module, if you’re using Amplify with NGINX Plus. And then we look further into the access log and the error log to derive more metrics and measurements, to dynamically measure deep application‑specific behavior.
But, we want to assure you that Amplify is very, very careful about how data is collected. All of the data collection begins on the Agent, which takes filters and accumulators to generate just the information that you need in order for the Amplify core service to display the charts. We don’t gather unnecessary data; we only take what’s necessary for you to visualize. We respect your privacy.
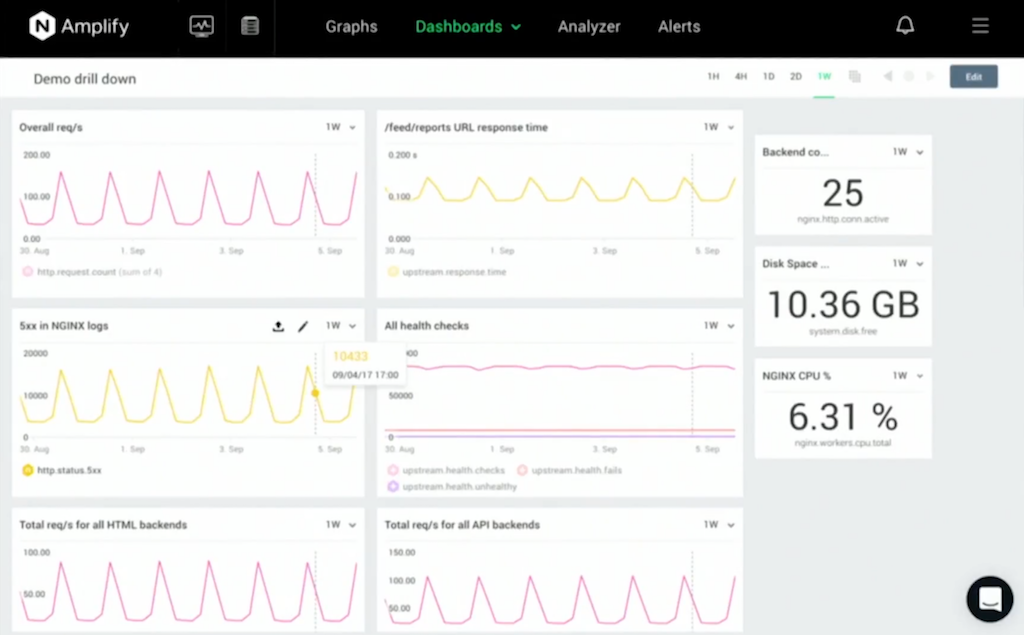
You can use the [individual] charts in Amplify, but it really comes alive when you look at the Amplify dashboards. Amplify dashboards allow you to create custom charts, and then assemble them together into your own dashboard view.
Some use cases – the kind of custom graphs that you can create:
- You can monitor NGINX performance by drilling down to a particular application or microservice, maybe looking just at a particular URI path.
- You can drill down into individual virtual servers, and then you can group those together, so you can look at the performance of a group of NGINX servers, maybe your frontend load balancers or your intermediate caches.
- You can drill down into detailed breakdowns of metrics, like HTTP status codes per application, and then you can take those filters, and you can fit them together to create really rich ways of filtering data multiple times, multiple metric dimensions. For example, you could look, focused on a particular URI, and then just count and monitor the number of post requests for that URI.
So, hugely rich monitoring and analytics information.
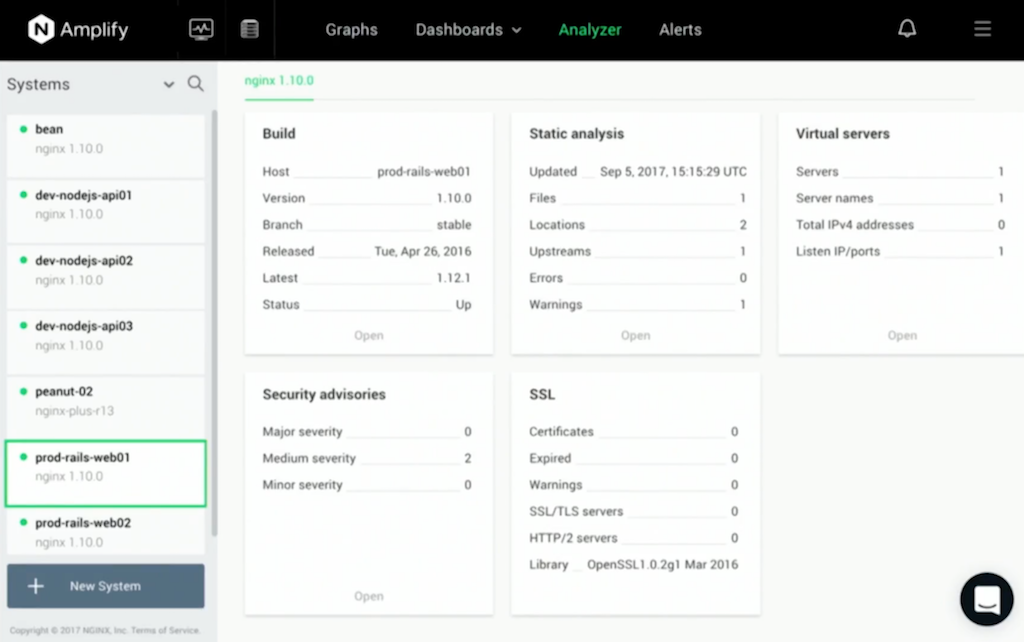
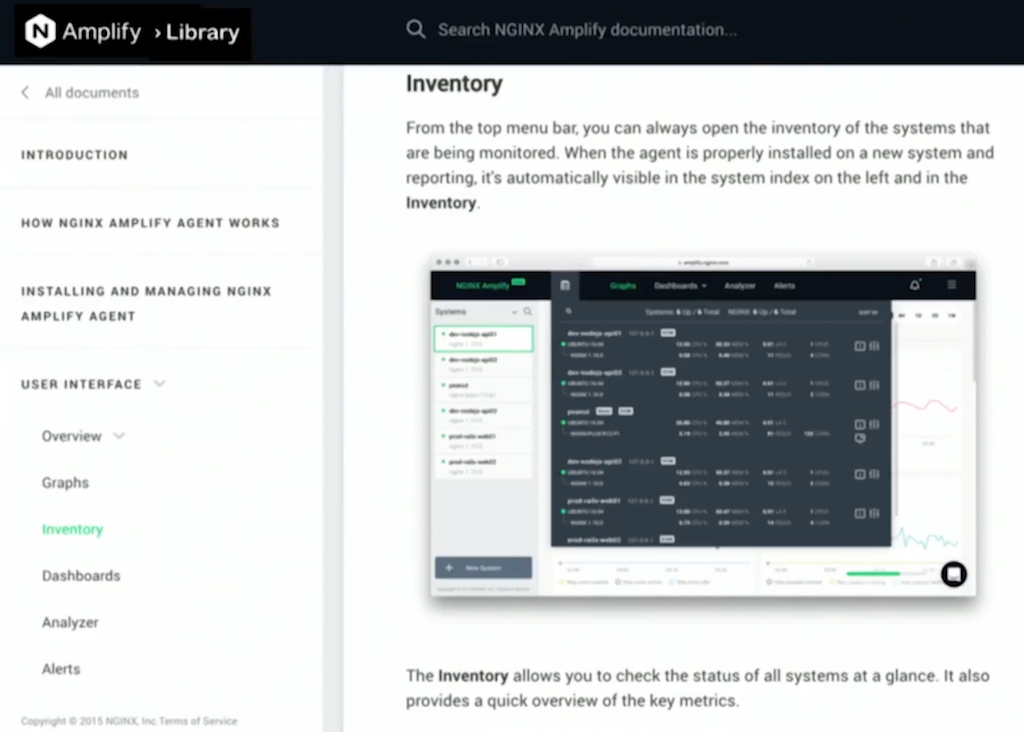
The second capability in Amplify is the deep insight that it gives you into your NGINX status, the systems you’re running on, and your configuration. It begins with an inventory: a great way to check out the status of your nodes and to remind yourself of the size of the hardware, and the operating system parameters – maybe the Amazon EC2 image that you’ve deployed for each one.
For each NGINX node, we give you a range of information. For example, the Amplify Agent has the intelligence to be aware of vulnerabilities or issues that were fixed in older versions of NGINX. It lets you know if you’re running an older version, and enumerates what the potential fixes are. You may then wish to make an informed decision to apply an update.
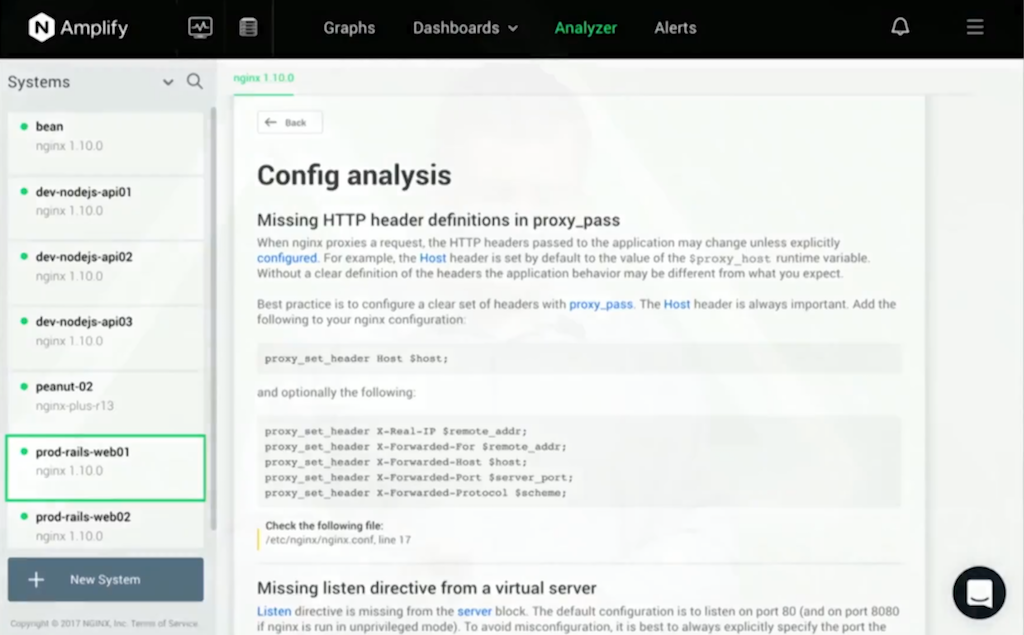
My favorite feature in Amplify is the configuration analyzer. Amplify can parse your configuration locally, and then it passes back up a secure, depersonalized version to the core Amplify servers. It doesn’t include sensitive information like usernames and passwords or SSL certificates.
Based on our experience of looking at hundreds and thousands of NGINX users’ configurations through community support and the commercial support channels, we’re very aware of the common mistakes that users make when they configure NGINX. The config analyzer looks out for those mistakes.
It picks typical configuration gotchas, such as; missing server_name directives. It gives you advice for proxy configurations. It’s smart enough to look at the rewrite and location directives that you’re using, and it can give you optimizations or hints on how to improve those.
It’s very security‑aware, of course. It will look at things like the stub_status directive, and it will warn you if you’ve forgotten to put an access control around that directive.

And finally, the monitoring capabilities in Amplify are of no use if you have to get some poor soul to sit and watch the dashboards all day. For that reason, you can configure alerts on any of the monitored metrics, define them with thresholds and time periods, and when an alert is triggered, we’ll ping an email out to the nominated admin.
There’s a rich roadmap for Amplify, looking into the future. For example, we’d love to be able to call a webhook as a result of an alert being triggered. Wouldn’t it be fantastic if you could monitor your NGINX devices, call a webhook, and integrate with other services, executing an “if this, then that” rule?
Next: documentation. I think it’s fair to admit that documentation hasn’t consistently been our strong point. We’re getting better. We’re investing heavily. Amplify is exemplifying how good documentation for a SaaS service like this can be written. There’s been a lot of effort, from the detailed instructions for getting started and installing the Agent, through to advanced configuration.
And if the documentation doesn’t tell you what you need, we’re running a chat feature so you can get in touch with the Amplify team. The chat feature, at the moment, is not always available live, but we’ll get back to you about any questions as soon as is practical.
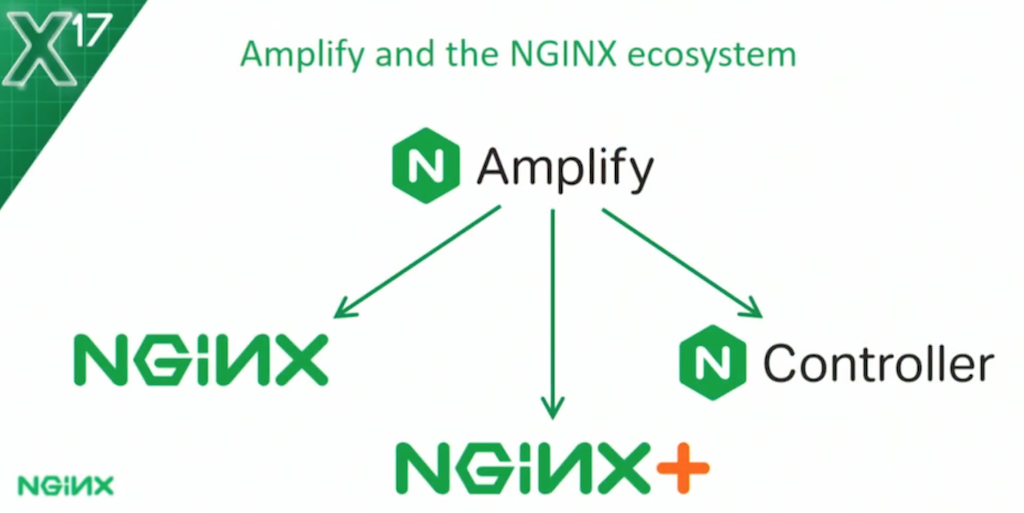
How does Amplify fit into the NGINX ecosystem? Amplify is being integrated everywhere. Of course, NGINX is the primary target. We created Amplify as a way for community users to monitor and track what’s happening with NGINX.
Amplify can also monitor NGINX Plus in exactly the same fashion. When it does so, it’ll also pull out additional data from the Extended Status module. This gives you an alternative view to the NGINX Plus dashboard that you may know and love.
And, finally: NGINX Controller. As we build our Controller, the roadmap includes taking Amplify and embedding that directly inside Controller to create a private, on‑premises installation of Amplify. Controller’s monitoring capabilities are “powered” by Amplify.
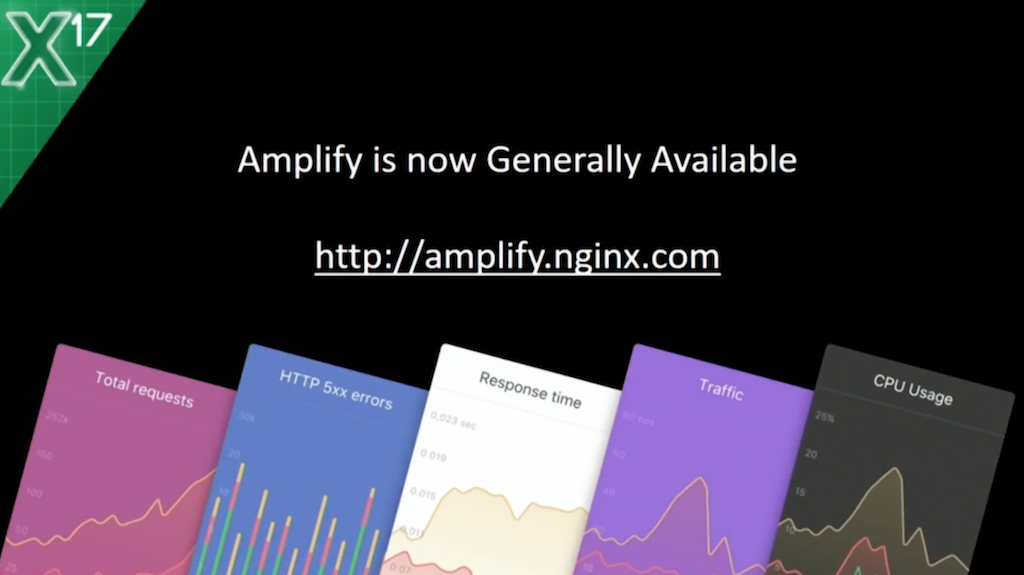
Amplify is now generally available – no longer beta. There is a free tier, so you can sign up now. You can start monitoring your NGINX instances at no cost, no obligation. For higher usage, you can move on to a paid tier which is designed just to cover the cost that it takes us of hosting and managing and developing the Amplify service. And for paying users, we provide support through our primary support team.
This has been a great conference. There are so many things that we’ve shared with you. As a product team, we wanted to end the second‑day keynote on a high. We’re really excited about what we, as a company, have achieved with Amplify, and I hope that you are, too. As we bring things to a close, thank you again.


